The Pro Trader's Checklist: Define Value
In my last article I presented a checklist of professional trader inquiries used to create strategies and implement trades. Pro traders are inquisitive and use all available technical and fundamental data available. Most of us do not have access to research teams so we must learn to interpret price action to get some answers.
To be a pro trader is to be a price investigator. The two most common questions I experienced as a broker were, who is buying/selling and how much? They wanted to know if bulls or bears were dominant. To define that we must first define a fair price. After all, momentum is the move from a fair price.
A fair price is the level that buyers and sellers transact most often, a.k.a. the high-volume price. To define a high volume-price we can use time. The theory is, the more time spent at a price, the more volume accumulates thus making it fair. And we need to define a fair price to determine momentum.
To determine a daily high-volume price, I use a bell curve. With this tool, we can track range (vertical dimension or high minus low) as well as time at price (horizontal dimension). The macrograph below displays daily price action using time and price. Each profile displays the high-volume price of the day, which is the price that sticks out the furthest to the left. This is the first step in identifying a fair value area. Once we define a fair price, we can construct a fair value area. A value area covers one standard deviation of volume around the mean or high-volume price. Fair value areas are critical when defining risk. Defining risk is on the trader checklist and will be covered in a future article.
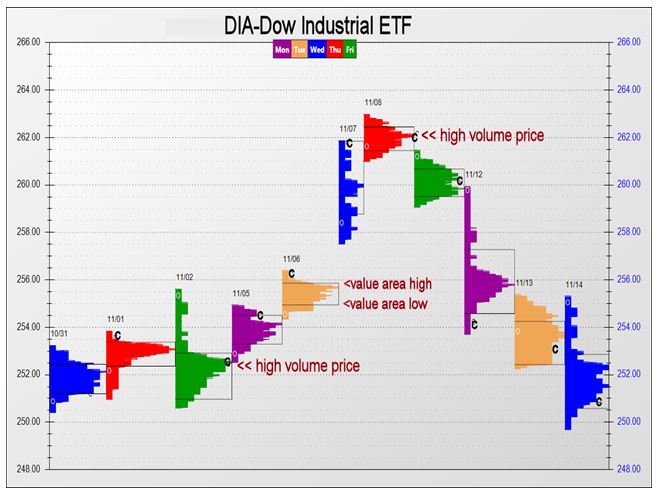
A high-volume price can be used to determine if bulls or bears are controlling momentum. The chart shows when there is a close above the high-volume price there is a tendency to continue higher in the next period. Conversely, closes below the fair price tend to lead to lower prices in the next session.
There are so many variables a trader must consider before executing an order to buy or sell. Learning to interpret short-term price action using charts can help get probability in your favor. A great foundation begins learning to determine a fair price.
John Seguin, Market Taker Mentoring
