Think Like a Pro to Trade Like One
Spend time with a broker or pit trader from the era when all trades were executed by brokers in trading pits at exchanges and you will learn about open outcry and the information it provides. Pits were created to facilitate trade. To an untrained eye a trading pit looks like a ring filled with angry, aggressive people wearing badges on various colored jackets. But for a seasoned observer a trading pit reveals incredible amounts of information not available on screens or trading platforms. Professional traders monitor order flow. Pro traders use a combination of market-generated information (technicals) and fundamentals (supply/demand or earnings) to define and refine strategies.
Seek an Edge
While at the CBOT and CME one of my duties as a broker was to relay and interpret price action to institutional traders and fund managers. Think of a color commentator at a sporting event. For example, a bank from New York would call and ask who or what firm was buying or selling and how much. Meanwhile, a fund manager from overseas might ask how big the bid or offer was to find out if buyers or sellers were dominant. Another client might inquire if volume was above or below average. Some traders sought support levels to buy or resistance prices to sell against. Some just wanted to know where to set risk or stop loss orders. They were seeking an edge. The questions varied, but there was some consistency to the information professional traders seek.
Think Like a Pro
To create a discipline or strategy follow the path professional traders take. The goal: Find the answers to the questions pros ask, day in and day out. I condensed these questions into an easy to remember acronym: VERTEX. To trade with pros, we must think like them.
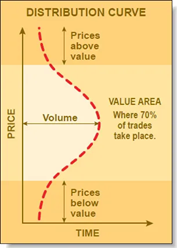
Determine Value
The “V” stands for Value. Value used to be determined by monitoring time at price. When charting you can define value using market profiles or bell curves. Or many services provide actual volume at each price using a histogram. A trader who understands fair value can also determine if bulls or bears are controlling momentum.
Trends Require Energy
“E” is for Energy or momentum. Before markets begin to trend, they often go through a consolidation phase. I believe markets store energy during such phases. Consecutive days with below average ranges and volume, along with similar opens and closes (small body candles), are common just before breakouts. Increased time spent in a consolidation phase often leads to more powerful vertical moves. Option traders might find this valuable when looking to purchase straddles and strangles.
Define Risk
The “R” represents Risk. Risk is an unexpected change in momentum. One of the toughest tasks a trader faces is to admit when a trade has gone bad, thus accepting a loss. There is no standard for defining risk, but for a start refer to the ATR (average true range). I frequently use a percentage of an average day range (ADR) to define risk and set profit targets. For example, risk is set at 25% ADR and profit is 75% ADR.
Timing Trends
“T” stands for Timing. Markets trend and consolidate and the cycle repeats. When a market is considered overbought or oversold it has moved too far too fast, thus favoring a rest period or consolidation phase. Therefore, the timing is not ideal to enter a trend type trade. On the other hand, when ranges and volume are below average during a period of consolidation, odds increase for a breakout or trend to begin. A trader should track ranges in various time frames (day, week, month). ATRs (average true range) can be used to identify when a trend is near an end or about to begin.
Entry Levels or Support/Resistance
The second “E” stands for entry. Support or buy levels often form where long positions were previously taken (double tops/bottoms). Resistance levels form where sellers previously took a stand. Support/resistance areas (reversals) also form in defined old congestion zones. They are especially effective when retesting an area where a previous fundamental event changed the course of a trend. In other words, when old breakouts prices are retested, reversals often occur.
Project Exits
The “X” in VERTEX refers to eXit. This can be defined as a risk level or projected profit. Traders seek to ride a trade or trend until exhaustion. In other words, they seek maximum profit while minimizing risk along the way. Trailing a stop at a percentage of an average day range is a solid strategy. Once in a lucrative trade the goal is to mitigate risk as quickly as possible and pocket profits while the trade moves in your favor.
John Seguin, Market Taker Mentoring
