How to Define Risk Using Time
To define risk immediately after a position has been taken, I first need to define the fair value area using intraday charts. An average trading session for stocks and ETFs lasts 6.5 hours, or 13 30-minute periods. Seventy percent of that is 9, and 9 divided by 2 is 4.5. A value area covers roughly 70% of trade during the day. A value area has a top and bottom and illustrates the highest concentration of volume. In other words, it is the area that buyers and sellers transact most often.
To construct a value area, I search for a price near the top of the range that has traded in 4 or 5 30-minute periods. The bottom of fair value is near the lower end of the range and has also traded in 4 or 5 30-minute periods. The graph below illustrates recent daily value areas for IWM.
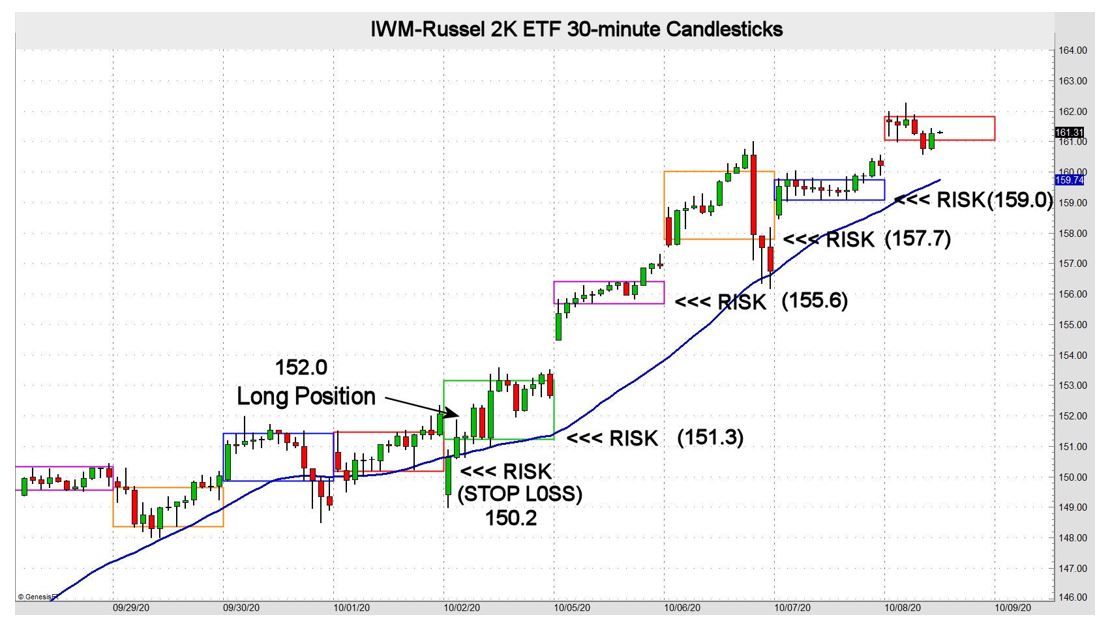
In the MTM Daily Edge coaching session, we got a buy signal last Friday (Oct. 2, 2020). After the position was taken at 152.0, a stop loss was entered. When taking a long position, I use the bottom of value from the previous day to define risk, or in this case 150.2. As the market moved higher in the ensuing days, I trail a stop using the bottom of value to lock in profits as time passes. Over the next 4 days a profit of $7 was locked in using this method. Conversely, if a short position is realized I use the top of the previous value area to define risk and trail stops. This approach of trailing stops is more effective after a consolidation phase of 3 to 5 days.
John Seguin, Market Taker Mentoring
Trader Education
- Educational Webinars for Traders
- Trading eBook
- The Options Insider Radio Network
- Market News and Education
- Set Profit Targets and Define Risk Using ATR
- Don't Forget to Add Up Option Greeks
- Understanding the Secret to Stochastics
- How Straddles and Strangles Work
- Check Your List Before Entering a Trade
- Option Trading and Life Are Not Perfect
- Identifying Price Patterns
- Hard Profit Taking Option Orders
- Define Support and Resistance Zones
- Theta Can Be Friends with Delta
- How to Handle Low-Volume Pockets
- Vertical Spreads Are an Option
- Focus on the Appropriate Moving Averages
- The Market Is Resilient
- Avoid Poor Trade Location
- It's All About Experience as an Option Trader
- The Shift in Fundamental Focus: Inflation vs. Recession
- Option Trades Near the Close
- Fundamental Shift and Volume Voids
- Be Patient When Markets Are Volatile
- Look to the Pros for a Trading Edge
- Your Option Trading Day in a Nutshell
- Best Uses of Bollinger Bands
- Take Advantage of a Bullish Base
- Use Chart Techniques to Trade Like a Pro
- Look For Pullbacks in NVDA
- Versatility of Average True Range
- Interpreting Technical Nuances and Market Reactions
- Smart Traders Record Their Trades
- Trade With Passion and a Plan
- Watch How a Stock Closes
- Finding the Ideal Trade Location
- Delta Is Lead Dog for Vertical Credits
- Dealing With Market Pace Problems
- Option Trading Is Almost Always a Trade-Off
- Seek the Answers Professionals Do
- What Has a Better Chance of Happening?
- Using Fair Value as a Trade Foundation
- Returning to the Proverbial Option Trading Well
- How to Use Daily Pivot Prices
- Time to Tighten Up Your Option Management
- Improve Trade Entry with Timing Tools
- The Market Does Not Always Go Up
- How to Read Candlestick Cues
- Chat About Option Vega
- Note Patterns to Identify Market Trend Changes
- Theta Can Help Your Unwanted Delta
- Partner Stochastics with Divergence
- Option Greed Is Not Good
- Choosing the Right Trading Tools
- A Top Tool for Traders
- Take Some Time Off for the Holidays
- How to Improve Entry and Exit Prices
- An Alternative to Selling Option Premium
- How to Use Indicators in Your Trades
- Avoiding Stress as an Options Trader
- Reversals and Overbought/Oversold Markets
- Are You Making Time for Theta?
- Pro Traders Commit to Routines
- Do Not Roll Your Short Option Too Soon
- Taking Profits and Trailing Stops Using Targets
- Bear Call Trades on SPY
- Moving Averages vs. Pivot Points
- Are You Guessing Too Much as an Option Trader?
- How to Recognize Changes Indicating a Shift in Trend
- That Voice Inside Your Head
- Option Vega Can Be Tricky
- Patience and the Market Close
- Use Stochastics for Reversals, RSI for Momentum
- A Look at Technical Analysis Basics
- My Checklist for Entering Trades
- A Look at IV Levels Around Earnings
- Good Timing Reduces Risk and Increases Profit Potential
- Use Market Tendencies to Your Advantage
- Uncover Clues That End or Reverse Trends
- Basic Technicals for Choosing Trade Type
- Get Friendly in Your Trading
- The Benefits of Bollinger Bands
- Know Your Option Delta Basics
- Think Like a Pro to Trade Like One
- Volatility and Vertical Debit Spreads
- Timing Reversals Using Stochastics
- Successful Option Trading Is Not Easy
- A Pragmatic Approach to Trading
- Covered Calls Can Work Wonders
- Use ATR to Project Profit and Manage Risk
- Have You Written Your Trading Plan?
- Technical Tools to Fit Your Trading Style
- Trading Options After Gaps Can Be Difficult
- Panic Adds Pace to Market Movement
- A Good Old-Fashioned Bull Call
- How to Trade Volume Voids
- Improve Results with Profit Taking Orders
- Which Trade Indicators Pair the Best?
- Some Bearish Setups Are Bullish
- Tools of the Trade
- Meet Your New Best Friend
- Recession Fears Take Center Stage
- How Do You Feel About Adjustments?
- History Helps Determine Support and Resistance
- Using ATRs to Set Profit Targets and Define Risk
- Take a Trading Break for the Holidays
- Improve Your Trade Location
- Do Not Forget About Iron Condors
- Alleviate Stress With Timing Techniques
- Option IV Levels Are Important, But
- Set Your Rules for the Tools of Trading
- Trust Resistance Over Your Gut
- Choosing Moving Averages Based on Trading Time Frame
- Stop Always Thinking Bullish Trades
- Define Risk and Lock in Profits with Stops
- SPY Double-Bottom Was No Surprise
- How to Think Like a Trading Pro
- An Options Trading Routine Is Smart
- Prepare for Panic and Learn
- Use Positive Theta to Offset Delta Risk
- Make Publishing Your Game Plan a Priority
- Support and Resistance Are Your Edge
- How to Identify Market Extremes
- Option Management Is Key
- Technical Overload: Keep It Simple
- Understanding the Nuances of Option Delta
- Essential Technical Tools for Trading
- The Basics of Implied Volatility and Options
- How to Read Big Player Trader Patterns
- Tighten the Leash on Your Option Trades
- Gauging a Trend Too Far, Too Fast
- Long Puts Are a Viable Option
- Practical Uses for Average True Range
- Don't Be a Cocky Trader
- Take a Break From Options
- What Do You Know About Option Theta?
- Improve Timing When Entering a Position
- Understanding Risk and How to Reduce It
- Organizing Prices to Identify Patterns
- Most Option Traders Roll Strikes Too Soon
- Systematic Trading With Technicals and Fundamentals
- A Warning About Selling Naked Puts
- Your Checklist Before Entering a Trade
- How to Trade Low Volume Pockets
- Using Candlesticks to Catch Trends
- 2 Crucial Option Trading Mantras
- Enhance Trade Timing with Intraday Direction Indicators
- Trading Lower Highs and Lower Lows
- Using Average True Range to Identify Trade Type
- Trading and Filtering Continuation Trades
- Keeping the Context When Trading Patterns
- Wheats the Matter with the Grains?
- How to Diagnose Trend Potential
- Sprinting Into a Trend
- How to Choose a Stop Loss
- Choosing an Optimal Stop Loss
- Do This Before Placing Your Trade
- Before Trading, Ask These Questions
- Is Psychology Important in Options Trading?
- How to Save Time Scanning Market Patterns
- Can You Make Money Trading Options?
- Implied Volatility vs. Historical Volatility
- Trading Is Like a Box of Chocolates
- Is Option Trading Easy?
- When a Market Moves Too Far, Too Fast
- Using Iron Condors in Volatile Markets
- Learn How to Read Price Action
- How Does an Options Calendar Work?
- Uses for Average True Range
- A Look at Bearish Vertical Credit Spreads
- Liquidity Is King
- Your Option Trading Mantras
- How Will Employment Report Impact Markets?
- To Trade or Not to Trade
- Great Traders Create a Methodology
- Option Traders Often Adjust Too Soon
- Market Movement Speed Dictates Strategy
- When in Doubt, Option Spread It Out
- Pro Trader Move Markets
- Create a Manageable Stock Watchlist
- How to Scan Markets for Breakout Potential
- Using Spreads to Offset Risk
- How to Form Your Methodology as a Trader
- Find an Option Trading Friend
- How to Stock Your Trading Toolbox
- Not Option Trading Is a Gift to Yourself
- Identifying Trends and Turns Using ATR
- When to Consider a Spread
- How to Manage Your Trading Team
- Be Patient When Rolling Short Options
- Never Take Your Eye Off the Fed
- Consider These Strategy Building Basics
- Is It Safe to Trade Naked?
- Identify Trend Potential and Protect Profit
- Market Making You Anxious?
- How to Gauge Trend vs. Non-Trend Markets
- Navigating a Volatile Trading Environment
- The Trend is Your Friend More Times Than Not
- Is It Safe to Countertrade Extreme Moves?
- A Relief Guide for Stressed-Out Traders
- Picking Extremes in Extraordinary Times
- Volatility: The Key to Success in This Market
- Volatility and Volume Gaps
- Recognizing the Importance of Option Delta
- Adjusting for Spikes in Volatility
- Using Volume Voids to Your Advantage
- Using Support and Resistance to Your Advantage
- How to Tell a Trend Is Near Its End
- Your Option Routine Should Be Routine
- Think Like a Pro to Trade Like One
- How Many Contracts Should You Trade?
- How Do Economic Reports Rank by Impact?
- What You May Not Know About Option Delta
- How to Gauge Volatility for Q3
- Feeling Superstitious? Reduce Your Risk
- How to Define and Scale Risk
- Does Your Option Delta Make Sense?
- Using Market Tendencies to Your Advantage
- Option Spreads Can Offset Risk and Much More
- How to Identify Reversal Points
- Make Friends With the Market
- Fundamental Data Come First
- Option Profits Can Come Quickly
- Keep Your Cool During Market Panic
- Want to Get Better at Option Trading?
- Rolling Options Requires Patience
- How to Define Risk Using Time
- When a Stock Reaches a Target Area, Do Something
- A Look at 'Cup and Handle' Chart Patterns
- Option Greeks Multiply Like Rabbits
- The Ins and Outs of Inside and Outside Signals
- Long Calls Are an Option That Can Work
- A Look at Sector Relationships
- Know Your Option Trading Environment
- Track Seasonal Trading to Gain an Edge
- Spreads Can Be an Option Trader's Best Friend
- The Value of Average True Ranges
- Call Credit Spreads for a Non-Bullish Environment
- The Power of the 'King Candle'
- What Does Option Trading Mean to You?
- What You Can Learn From Liquidity
- Understanding Stop Losses and Options
- The GameStop Phenomenon: Pro vs. Retail Traders
- Use Fundamental Data to Set Risk and Profit Targets
- Know the Greeks and Their Potential Impact
- Gauging Market Speed and Reversals
- A Look at Bullish Option Strategies in NIO
- Build Your Own Technical Toolbox
- Remove Risk First, Consider Profits Second
- How to Create a Pre-Trade Checklist
- Keep an Eye on Implied Volatility During Earnings
- Make Time to Study Options Trading
- Option Traders Need to Consider Spreads
- Identify Neutrality for Trend Reversals
- What Does a Bullish Base Look Like?
- Confirm Market Turns Using Stochastics
- Sometimes Doing Nothing Is a Trader's Most Profitable Move
- Identify Trend Potential and Entry Levels
- Long Calls Are a Solid Option
- Use Dimensions for Timing Breakouts and Setting Targets
- Keep Your Trading Watchlist Fluid
- Pandemic Panic and How to Adjust Your Trading
- Your Regular Reminder to Review Your Option Trades
- How to Use Bollinger Bands
- Have You Checked Your Option Vega?
- Top Techniques for Defining Support and Resistance Areas
- Do You Guess Too Much as an Option Trader?
- Options Arbitrage and Valuation
- An Option Spread Can Relieve Some Doubt
- Cures for a Trader's Optimistic Bias
- Waiting for a Move Through Resistance
- Shedding Some Light on SPACs
- Removing Risk as an Option Trader
- Don't Trade While Inattentive
- Do You Have Time for Theta?
- Understanding the Seasonality of Implied Volatility
- Is Option Risk Worth the Reward?
- Meme Stock Phenomenon Sparks FINRA Crackdown
- Earnings Season Is Not Time for Naked Puts
- Impact of Increased Retail Trading Volume
- Varying Contract Size to Manage Risk
- Understanding Dividends and Options Trading
- When in Doubt, Consider a Spread
- A Brief Lesson on Pairs Trading
- Making Option Delta Easy to Understand
- Trading Software and Hardware Optimization Improves Your Win Rate
- Improve Your Odds for Trading on the Close
- How to 'Safely' Trade Crypto/Blockchain Assets
- Morning Gaps Can Be a Head Fake
- The Impact of Inflation on Financial Sectors
- Calendar Spreads Ooze Positive Theta
- How To Protect Yourself from HFTs
- Learn Options Trading with a Paper Trading Account First
- Stock Options Advice: Investor, Know Thyself
- Synthetics in a Low Volatility Environment
- An Effective Strategic Option Trading Plan Requires Flexibility
- Flash Boys and the Tower: FCC License Number 1215095
- The Greeks
- Creating a Low Cost Collar
- How Patience Will Earn You Money In The Stock Market
- Advanced Trading: Going Long and Short on the Same Instrument in the Same Account
- Butterfly Spreads: Part C
- Understanding Butterfly Spreads: Part B Variations
- How to Get Your Wife to Support Your Trading
- Butterfly Spreads - Part I
- When Should You Take Advantage of the Early Exercise Right?
- Understanding Front Month Gamma
- Subscribe to the Traders Exclusive Video Feed
- Watch Traders Exclusive Videos on YouTube
- Follow Traders Exclusive on Twitter
- Become a fan of Traders Exclusive on Facebook
