Using ATRs to Set Profit Targets and Define Risk
Around year’s end when the markets are generally quiet, I do some statistical analysis to prepare for the New Year. There is one spreadsheet of vital statistics I generate and use daily. It consists of recent average ranges and benchmark ranges for stocks, ETFs and commodities. Most charting platforms have the ATR (Average True Range) indicator. ATRs are valuable because they improve our ability to set profit targets and define risk over various time frames. Furthermore, a comparison of near- and long-term benchmarks can be used to determine if volatility is rich or cheap.
Trade Type
One reason for comparing historic and current data is to identify trend potential. When recent day and week ranges are far below the benchmark (long-term average), odds increase for a breakout or onset of a trend. Under these circumstances buying options and/or debit spreads tends to be more effective. On the other hand, when recent ranges are far above the long-term standard, a consolidation phase typically follows. Thus, selling premium or executing credit spreads tends to be a better approach. Think time decay or theta trades (short options).
Vertical Targets
Once a trend or breakout begins, we need to project how far the market will travel and how long it will take. I frequently use ATRs to set targets over various time frames. This is especially useful when a market is in uncharted territory. For example, assume a market has been in a tight range for five sessions. Let’s also assume volume has been below average and the day ranges are lower than standard. If the opens and closes are similar as well, probability favors a sharp vertical move. Straddle purchase may pay under these conditions.
Here are some basic rules for creating profit targets. When the direction of a breakout is recognized, the next step after entry is to set risk and then project profit targets using ATR. The first target should be the length of an average day. Target 2 is the length of an average week, and an average month range could be target 3.
Event Volatility
During big events like earnings or economic reports volatility often rises. Volatile sessions and above average ranges are anticipated. During earnings season price projections become more difficult. ATR can also be used to determine if a market has moved too far too fast…otherwise known as overbought or oversold. For example, if a market moves the length of an average month in a week it is thought to be overdone. Thus, a countertrading strategy may apply. This method is a good framework to begin with. I use many variations (percentages) of this technique when testing theory.
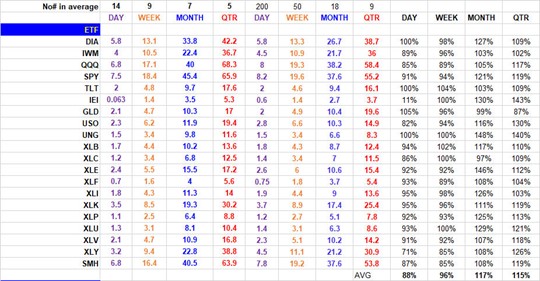
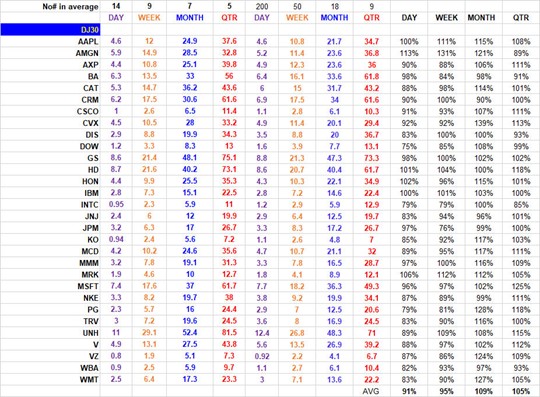
The ATRs I prefer for comparisons are:
- 14 days vs. 200
- 9 weeks vs. 50
- 7 months vs. 18
- 5 quarters vs. 9
Find time for research to create your own spreadsheet of average ranges of your favorite stocks or commodities. A good trader prepares and has pertinent data available to set risk and targets immediately after entering a position. To get you started for the New Year I’ve inserted the most recent data. The last four columns show the percentage of the near- and long-term ATRs.
Click here to download the data as a pdf (for better readability or to print).
John Seguin, Market Taker Mentoring
