Identify Trend Potential and Entry Levels
To identify the onset of a trend, go to the root and search for patterns that frequently precede one. By doing so we improve the odds of entering a trend early.
Pre-trend Setups
Above average vertical moves often occur after a market has gone through a period of choppy trendless trade, also known as a consolidation phase. Think of the trendless period as the time it takes to build up energy, like a pressure cooker. When that pent-up energy is released, the move is often directional and rapid. The more time spent consolidating, the bigger the breakout is apt to be.
The most common short-term setups that precede a breakout involve a series of five to 10 days with similar or overlapping prices. Day ranges and volume tend to dip below average during this setup. Furthermore, opens and closes are often near each other (small candlestick bodies), which is an indication of impartiality. This pattern has a rectangular shape and is commonly called a flag pattern. Another pre-trend pattern takes the shape of a triangle or pennant.
Identify the Breakout
Breakouts are often fast and furious at the outset, so to catch them early we must recognize the signs and act quickly. Hesitation can be costly because late entry adds risk and reduces profit potential. When a flag formation is realized it is time to focus on intraday or short-term time increments. One popular method for identifying a bullish breakout is to look for two consecutive positive daily candles above the top of the flag formation or trend line of a pennant. To catch a bearish breakout, wait for two daily negative candles below the flag bottom or pennant trend line.
Enhance Timing
To improve timing when entering a position, I prefer using 30-minute candles, especially early in the trading day. Liquidity (volume) peaks during the opening 60 minutes of the trading day and the last 30 minutes of the session. Professional traders tend to be most active during those times because they can execute large orders without hurting their position. Fundamentals move markets and pro traders have access to better research and development than we do. Thus, we may discover their bias if we focus on the periods when they are most active. Consequently, a move above or below the flag or pennant formation in the first hour of the day is often the cue to take the trade. A late day move above or below the flag usually leads to continuation in that direction.
Trader Traits
Traders are like snowflakes: No two are the same. Account size, risk and time are factors that determine trader type. Long-term traders require timing tools just as speculators do. Long-term traders refer to daily and weekly directional indicators. A 50- and 200-day moving average are standard with this group. Generally, mid-term traders use 5- to 20-day setups to gauge breakout potential. Speculators rely on intraday signals. It does not matter which trader type suits your personality and risk parameters; the process is the same.
Favorite Filter
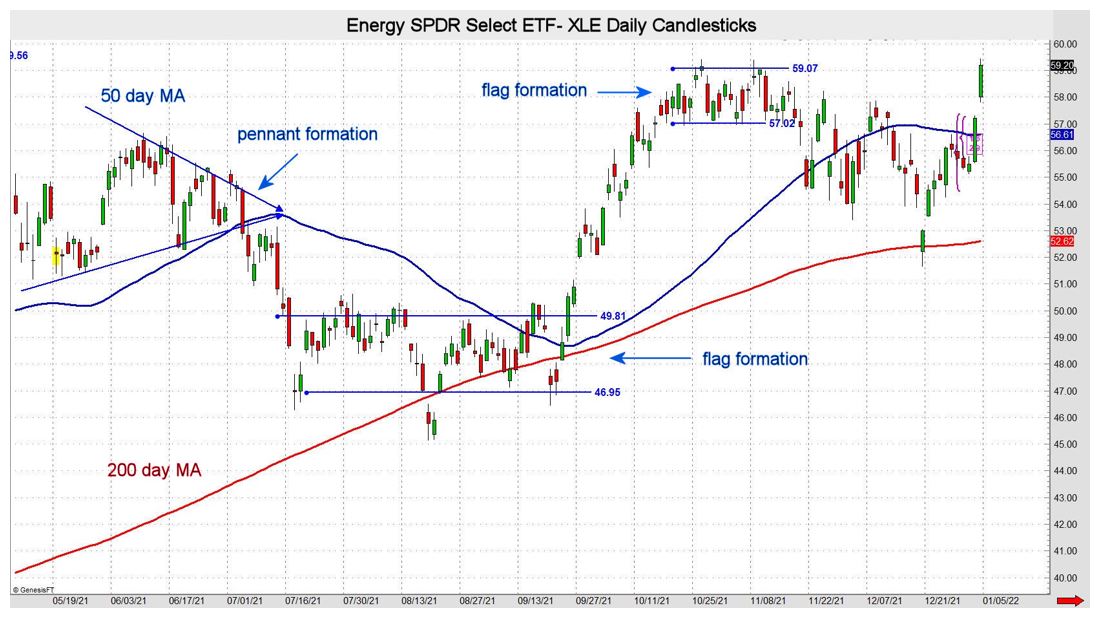
The graph below shows a couple of pre-trend setups for the energy ETF (XLE). Each shows a consolidation phase just before a vertical move. If you are looking for breakout trades, search markets that have below average ranges and a series of similar ranges and closes.
John Seguin, Market Taker Mentoring
