Market Movement Speed Dictates Strategy
Extraordinary moves both up and down were frequent last month. Choppy trendless trade typically follows large vertical moves. August began with a bang after the trade war with China escalated. The sharp decline lasted three days, and the range exceeded the length of an average month. A move of that speed and magnitude brought on an oversold signal. When markets get severely oversold/overbought, they frequently go through a few weeks of erratic trade where trends last for two or maybe three days before reversing. A pennant often forms during these consolidation periods. Speculators or short-term traders tend to excel while this pattern takes shape.
The SPY chart below shows daily bell curves or profiles, which reveal another dimension to use when creating strategies. The horizontal measurement or time at price displays the fair price. A close above a fair price is thought to be a bullish signal, and a finish below the fair price is bearish. During volatile times I like to combine or stack the profiles. By creating a summary profile, a fair or pivotal price is often revealed (shown in chart). In chaos, there is often order.
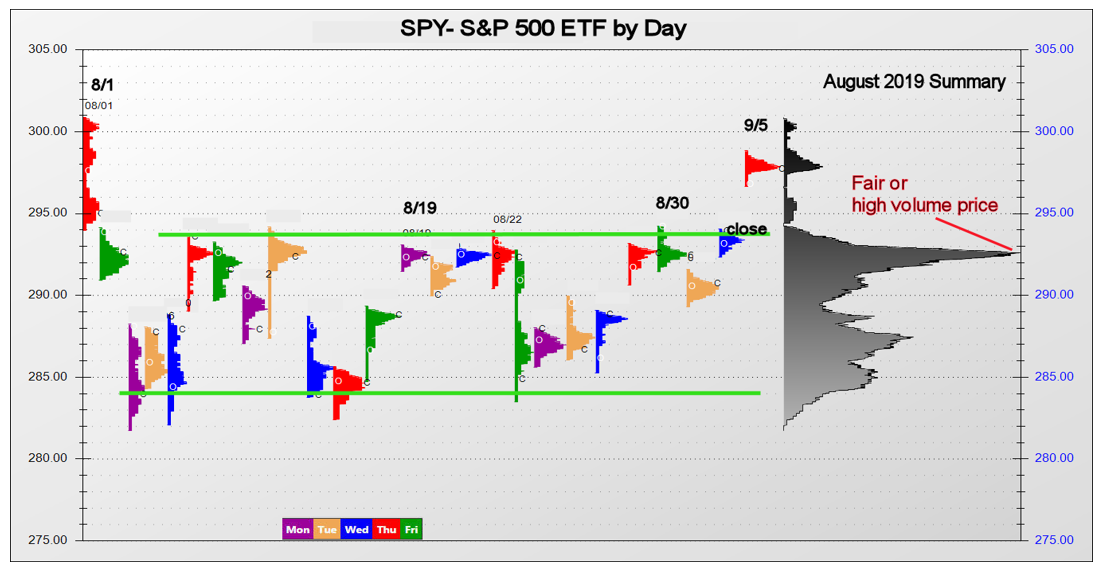
During the past 20 days in August, SPY bounced off the upper and lower bands of the pennant seven times. This is a speculator’s dream setup and a nightmare for trend traders.
Counter trade strategies work best after extreme vertical moves. After a pennant forms and a high volume or fair price is identified, the odds for a swift vertical move increase daily. Thus, prepare to enter a trend phase. On Wednesday of this past week, SPY settled above the fairest price of the consolidation phase, as well as the upper band of the pennant. A sharp move higher ensued.
Markets move and coil and do it again. Early recognition of the current phase can guide us to apply the appropriate strategy…trend or counter trade.
John Seguin, Market Taker Mentoring
