Organizing Prices to Identify Patterns
Before computers were used for charting on the CBOT trading floor, books were published weekly that had day and week bar charts for all the futures markets. On the exchange trading floor, many traders used handmade graphs to track short-term price action with intraday bars using open, high, low, close (OHLC). Some used the point & figure technique and eventually candlesticks became popular. Charting or technical analysis is mapping and organizing prices to identify patterns.
Technical Tags
Numerous books have been written on seemingly countless patterns. There is terminology to describe popular patterns using the bar or point & figure style, such as flags and pennants, trendlines, head & shoulders, gaps, island reversals, and triangles to name a few. Some of the basic patterns for candlesticks are known as hammer, doji, hanging man, shooting star, spinning top, and morning and evening star. Technical analysts tag patterns with names to identify opportunities. Ideally, if one recognizes a certain pattern, it may telegraph the next move.
In the mid-1980s I read “Markets and Market Logic.” The author, grain trader Pete Steidlmayer, was also the creator of Market Profile. I do not think it is necessary to use Market Profile. But applying the logic behind the tool allowed me to create a charting technique that incorporates the best parts of many technical disciplines.
Finding Value
Each tool and technique is valuable in its own way. So, why not take the best parts of your favorite indicators and design strategies that are unique to your trading style? Markets do two things: trend and consolidate or rest and run. And they do this in varying time frames, hour, day, week, etc. When it comes to pattern recognition, I find it best to organize price action into structures that reveal fair value. Momentum is defined as the movement away from fair value. Thus, if we want to catch a move at the onset of a trend it is important to determine a fair value area first. The goal is to identify the most common patterns that precede a breakout.
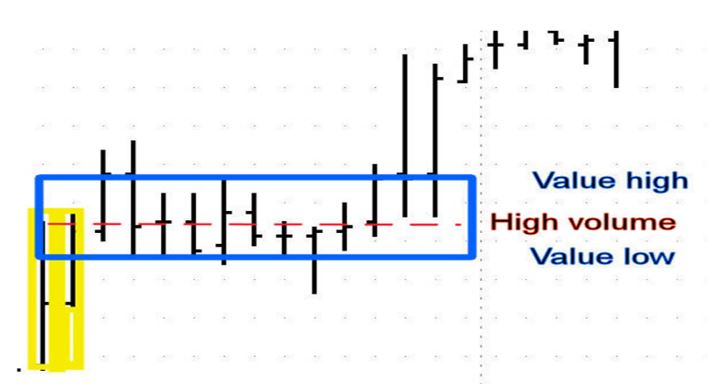
A daily fair value area was designed to capture one standard deviation of volume or roughly 70%. About a decade ago I came up with a method for tracking value without using bell curves (market profile).
A daily value area is shown. To construct one, I use a 30-minute bar chart and find the price that has the highest frequency. This is the fairest or high-volume price (HVP). Next check above HVP for the highest price traded in 4 or 5 30-minute periods. That defines value high. Value low is the lowest price traded in 4 or 5 3-minute periods.
Using Value to Catch Trends
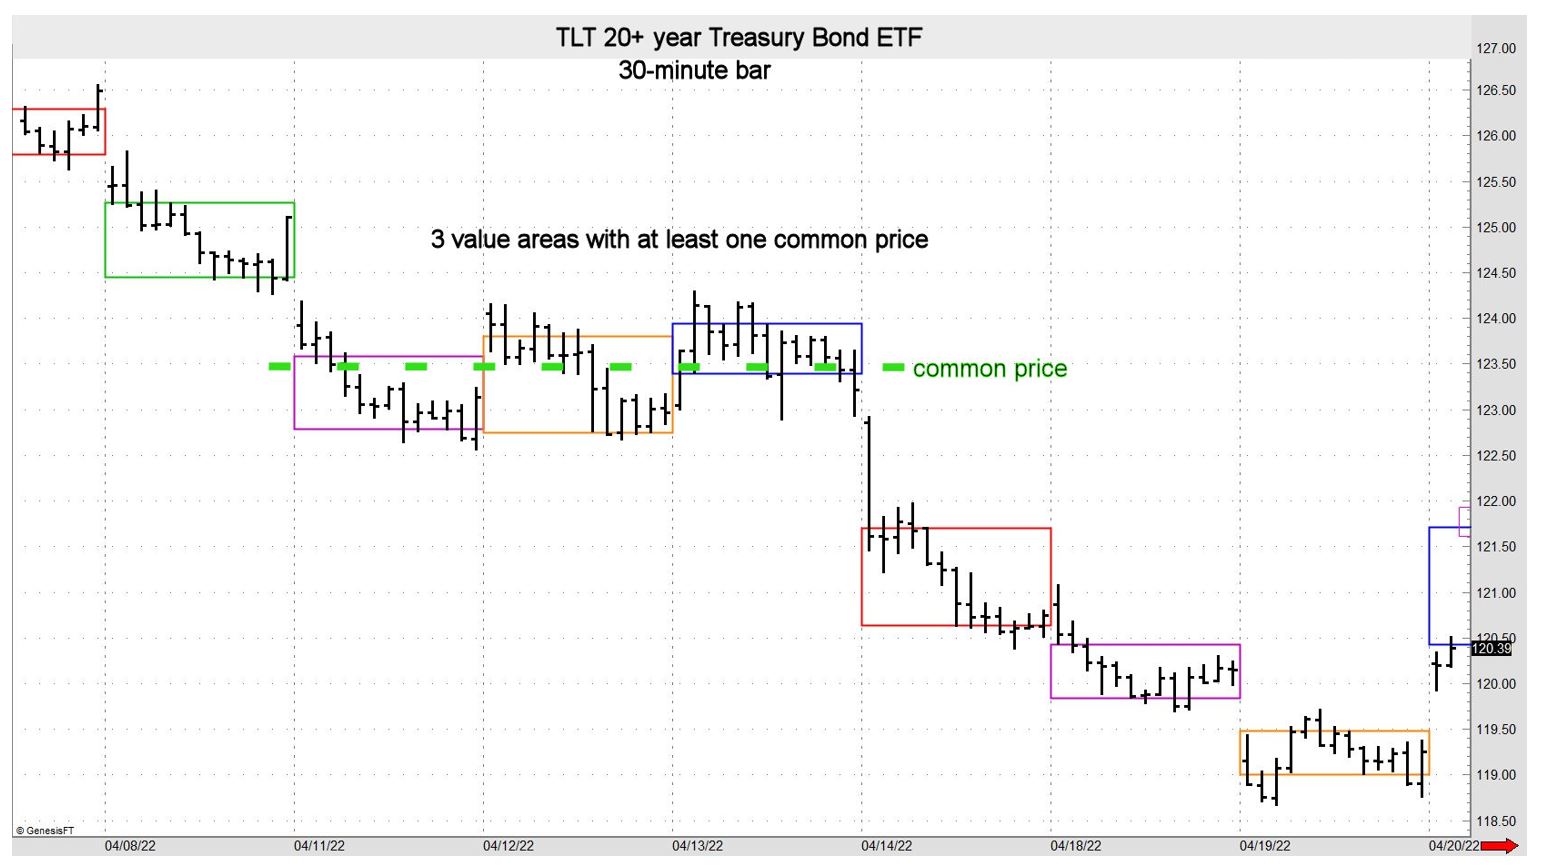
A daily value area does not give enough information to indicate whether a market is ripe to trend. However, when consecutive value areas have price overlap, odds increase for the start of a trend. An example of this pattern is shown below. After a few sessions of sideways trade (rest phase), TLT moved sharply lower (run phase). Markets move from balance to imbalance and back to balance. Organizing data into value areas allows the analyst to identify when odds favor the beginning of a trend.
John Seguin, Market Taker Mentoring
