Adjusting for Spikes in Volatility
When volatility spikes, profit potential increases as does risk. It is imperative to stay current with range potential for a few time frames (day, week, month) especially during a crisis when the VIX (volatility index) spends a lot of time above 20. When the COVID-19 virus took hold, this so-called fear index jumped from the norm of about 15 all the way up to 85. The last time VIX reached that high was early in Q4 2008 during the credit crisis. For the rest of that year stock indexes saw huge swings while the VIX oscillated between 40 and 80. It took about a year for the VIX to return to more conventional levels below 20. No one has a clue how long the impact of COVID-19 will last. Until we figure this out the VIX will likely gyrate between 25 and 65 for some time to come. Thus, the big swings in stocks are not likely to go away anytime soon.
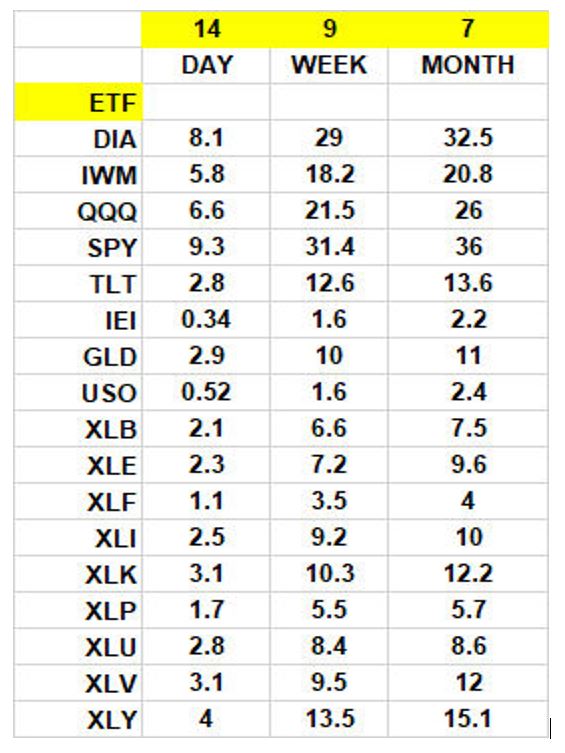
During extreme times I keep a spreadsheet of average ranges handy. At the nexus of the volatility spike the ranges for many sector ETFs (interest rates, stock index, precious metal, energy) grew to 4 or 5 times the standard. These numbers have come down but are still historically high. The main reasons for tracking ranges is set profit targets and risk. One of my strategies after entering a position is to set a profit target at an average week range and set risk at 50% of an average day range. The reward ratio far outweighs the risk. If I were to use out-of-date range measurements, I would be stopped out often because the recent swings are so vast. Thus, it is important to use numbers that are conducive to current conditions. To save you time I have attached the ETF portion of the guide I use daily. The averages I prefer for setting targets and risk are 14 days, 9 weeks and 7 months. If you want to create your own guide, find the average true range (ATR) indicator in your charting platform.
John Seguin, Market Taker Mentoring
