Good Timing Reduces Risk and Increases Profit Potential
Identifying when the odds are high for a trend to commence reduces risk while increasing profit potential. Timing this phenomenon requires a breakout strategy. Entry at the beginning of a sharp vertical move (trend) is the goal.
Pre-trend Setups
Perfect timing is entering or exiting a trade at the ideal price and moment. There are a few patterns that often precede a breakout or above average vertical move. Markets trend and consolidate; that is what they do. A consistent pre-trend indicator requires at least two components. First, define a consolidation phase because they frequently precede breakouts. Range and time dimensions are integral when calculating trend potential. After an acute vertical move a consolidation phase often follows, leading to another trend phase and the process repeats. Common factors in a pre-trend pattern include:
- Below average day ranges for three to five sessions
- A few days with little difference between open and close (small candlestick body)
- Five days with total range less than 50% of an average weekly range
Setting the Standard
To enhance timing a trend or directional trade, we need to establish standards first. These gauges will be used to judge when odds have shifted to favor an above average vertical move or, conversely, a period of choppy trendless trade. Premium sellers tend to do well during congestion phases. This type of pattern is common after a market reaches overbought/oversold status. When a market moves 175% of an average day range in less than 24 hours, it is deemed overbought/oversold.
Another measure to determine if the speed of a move is too fast is when a directional move spans the length of an average week over 48 hours. To monitor speed, refer to Average True Range (ATR) to set the standard. I prefer a 14-day average and a 9-week average as benchmarks.
Pre-trend Patterns
Two of the most common pre-trend setups are known as pennant (triangle) and flag (rectangle) formations. Volume and range length tend to dip below average while these patterns take shape. In the graph below the pennant shape shows a series of days with below average ranges, small candle bodies and severe price overlap prior to the breakout higher. Following the trend higher USO reached overbought status and entered a holding pattern. Short premium (theta) trades tend to do well while an overbought/oversold situation dissipates.
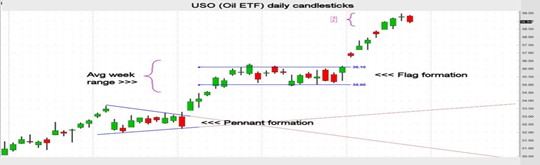
The flag pattern lasted a little more than a couple of weeks. The range over that time was roughly 50% of an average week. The more time spent in a consolidation phase, the more spring-loaded the market seems to become. Therefore, when it breaks free, the move is often fast and furious.
Identify Trends Early
At the onset of a trend volume tends to rise rapidly as price moves quickly higher or lower. When a market reaches the upper or lower band of a flag or the peak of a pennant, pay special attention to intraday charts. I prefer 60-minute candles. A trend higher often begins when the upper band is violated with consecutive bullish (green) candles and volume begins to rise. Many trends lower begin with penetrating the lower band with two red candles and increased volume. Use the same early indicators for the pennant pattern.
Options buyers often do well when catching a trend early. To do so, a trader should hunt for the patterns that are most common before acute vertical moves.
John Seguin, Market Taker Mentoring
