Using Average True Range to Identify Trade Type
At least once a quarter I make it a point to collect statistical data that will be used for choosing trade type as well as setting targets and risk. This vital information is stored in a spreadsheet, and one of the features consists of recent average true ranges (ATR) compared with benchmark or long-term ATRs for stocks, ETFs and commodities.
Use ATR to Determine Markets Phases
All charting platforms have an indicator that tracks average ranges. ATRs are valuable because they improve our ability to set profit targets and define risk over various time frames. Furthermore, a comparison of near- and long-term benchmarks can be used to determine if volatility is rich or cheap. Recognizing when odds favor a sharp vertical may also be revealed through ATR comparisons. For example, if recent day and week ranges are far below the benchmark (long-term average), odds increase for a breakout or onset of a trend. Under these circumstances buying options and/or debit spreads tends to be more effective. On the other hand, when recent ranges are far above the long-term standard, a consolidation phase typically follows. Thus, selling premium or executing credit spreads tends to be a better approach. Stock indexes are currently in such a choppy, trendless phase. Subsequently, neutral option strategies tend to do well in this environment.
Setting Profit Targets and Risk
Once a trend or breakout begins, we need to project how far the market is apt to travel and how much time it will take. I frequently use ATRs to set targets over various time frames. For example, assume a market has been in a range that is 50% of an average week for five sessions. Let’s also assume volume has been below average and the day ranges are lower than standard. In additions, if there is a series of daily candlesticks with small bodies (similar opens and closes), then probabilities are high for an acute vertical move that will span the length of an average week or more. Breakout strategies should pay under these circumstances.
Create and Follow Your Rules
Here are some basic rules I follow for one of my favorite trading strategies. When a breakout of a channel or triangle pattern is recognized, the next step after entry is to set risk. For this system I use 50% of an average day range from entry to define risk. The first profit target is the length of an average day. When that is reached take off 25% of the position and move the stop loss on remaining contracts to entry. Target 2 is the length of an average week, and an average month range would be target 3. As each target is hit take profit on another 25% of the position and move stop to previous target. This method locks in profit with trailing stops. ATR can also be used to determine if a market has moved too far too fast, thus favoring a counter trade strategy.
Compare ATRs to Calculate Odds for Trend/Consolidation
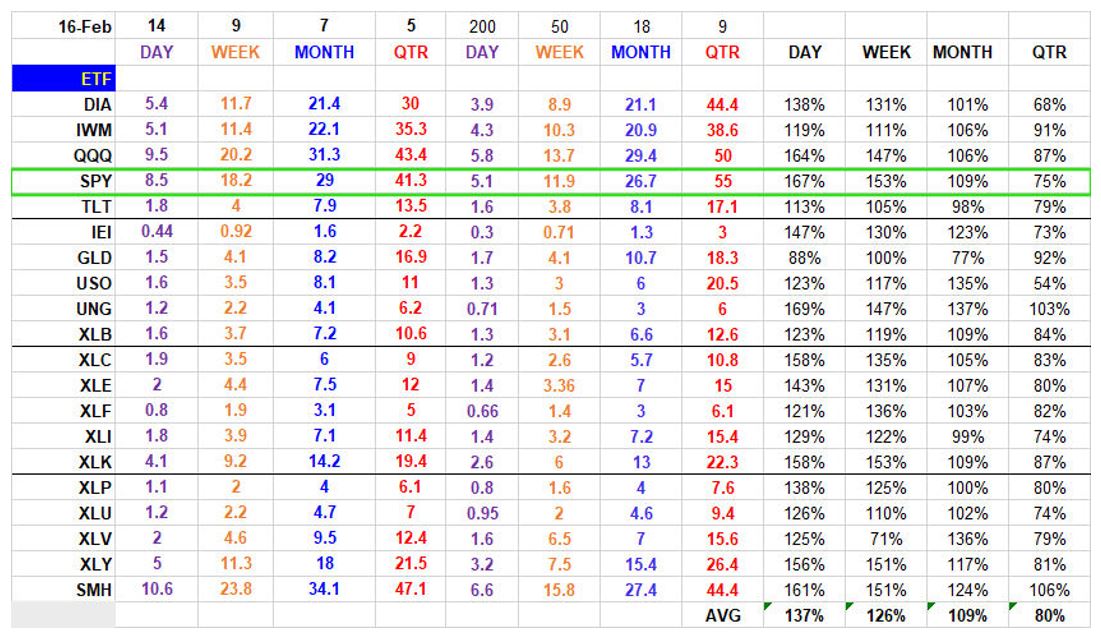
The ATRs I prefer for comparisons are as follows:
- 14 days vs. 200
- 9 weeks vs. 50
- 7 months vs. 18
- 5 quarters vs. 9
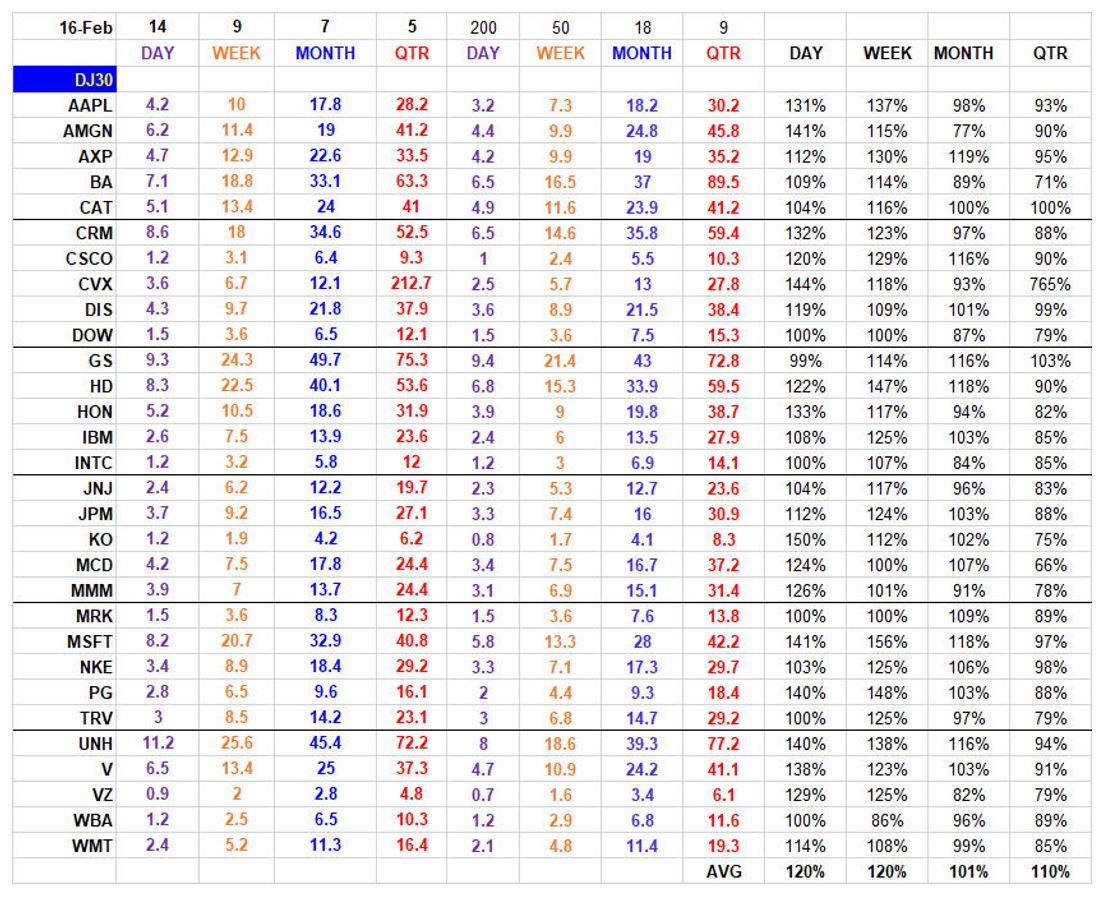
Find time for research to create your own spreadsheet of average ranges of your favorite stocks or commodities. A good trader prepares and has pertinent data available to set risk and targets immediately after entering a position. To get you started there are 2 tables below that include some of the most popular ETFs and Dow Jones 30 stocks. Note the highlighted SPY row. the last four columns show the percentage of the near-term ATRs to the long-term benchmarks. Current day and week range are well above the norm. Thus, credit spreads are apt to perform better than debit spreads.
John Seguin, Market Taker Mentoring
