Liquidity Is King
Traders are almost as unique as snowflakes. We all have different risk parameters and time frames and use an array of technical indicators.
Not long ago all trades were executed in pits at the exchanges. Buyers and sellers battled to gain an edge in these spheres of organized chaos. Years of watching and reporting price action allowed me to learn what information professional traders were seeking to create strategies.
Professional traders contacted brokers on the trading floor to not only execute trades, but to gather information on who was buying or selling and how much. With this information, the trader might be able to tell if a rally occurred because institutional traders were bullish and accumulating new positions. In this instance, the trend higher is apt to continue because bids (large buy orders) outweigh offers, hence prices rise. On the other hand, if the rise in price is caused by sellers exiting short positions, it tends to be short-lived and reversals frequently follow.
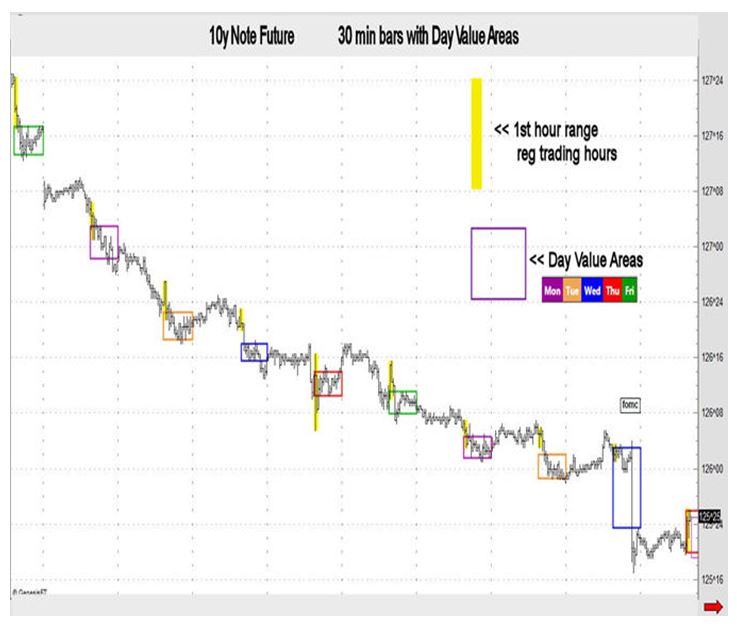
Large trades tend to be entered when liquidity is at its highest. The first hour and last half hour of the regular trading day are typically the high-volume periods of the session. On most days, the high or low is made within the first hour of trading. An early low and an extension higher after the first hour are strong indications that professional traders are buying. Conversely, when the high of the day is made in the first hour of trade and the market extends below that first hour low, it indicates that sellers are in control of momentum and lower prices are likely over the next 16 to 24 hours.
The chart below shows first hour ranges shaded yellow. Note that eight of the nine days extended lower after the first hour of trade. Also note that the high of the day was made in that first hour as well. The traits of a rally are early lows with extension higher after the first hour and closes tend to be in the upper third of the range. Characteristics of a bear market are early daily highs with an extension lower later in the day and closes tend to be in the lower third of the range. The chart illustrates a bear market move in 10-year note futures.
John Seguin, Market Taker Mentoring
