Which Trade Indicators Pair the Best?
There are many tools and indicators for traders. None are infallible, yet they all have strengths under certain conditions. One indicator may give a reliable directional signal, but that signal becomes stronger if the strategy has a partner indicator that confirms the buy/sell or neutral signal.
Stochastics and RSI Myth
There is a myth that Stochastics and RSI (Relative Strength Index) are both used to determine whether a market has reached overbought/oversold status, thus indicating when a trend is near an end or likely to reverse direction. However, RSI is more appropriate for gauging the strength of a trend. An RSI reading above 50 indicates bullish momentum, and a reading below 50 typically favors short positions. On the other hand, a Stochastic is a more reliable indicator for detecting market turns. A reading above 80 or below 20 is often used as a countertrading indicator. Many traders use these indicators together, but they perform better when used separately for the right reasons.
Divergence of Price
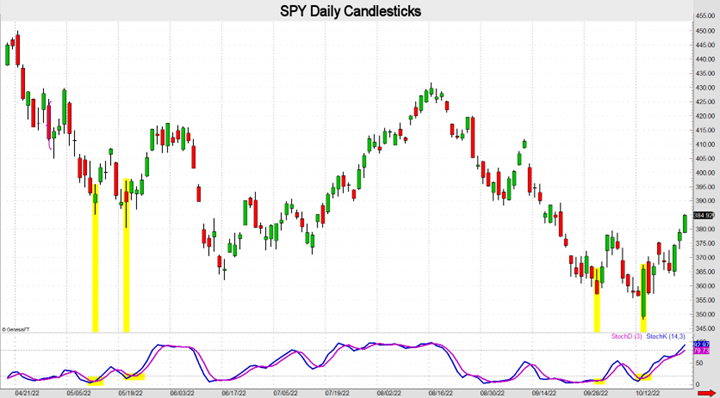
I prefer to use Stochastics partnered with a divergent indicator. The definition of bullish divergence is when price reaches a lower low, but the Stochastic registers a higher low. In this situation a bullish reversal frequently occurs. A bearish divergence occurs when a new high in price is not confirmed with a new high in the Stochastic. These phenomena reveal a loss of momentum and often foreshadow a reversal or pause in trend. The SPY daily chart below shows two examples of bullish divergence.
A Fast and Slow Combination
The Stochastic oscillator comprises the first line known as %K (blue line). The second line (pink) known as %D is a simple moving average of the %K. The default setting for the Stochastic oscillator is 14 periods and a 3-period SMA (simple moving average) for %K, which equals %D. In other words, %K is the faster moving Stochastic and %D is the slow one. Generally, the fast indicator is used for short-term trades and the slower Stochastic tends to be more reliable for longer-term trades.
Stochastic Crossing Signals
Simple moving average crossings are possibly the most popular technical indicator for new traders. Seasoned traders tend to employ more complex indicators, such as %K crossing %D Stochastics. When %K crosses below %D a sell signal is generated. Conversely, a buy signal is produced when the fast gauge crosses above the slow one.
Overbought and Oversold Levels
The Stochastic oscillator range fluctuates between 0 and 100 no matter how fast price ascends or descends. Traditionally, a reading above 80 is the overbought threshold and a reading below 20 is an indication of an oversold situation. A reading above 80 is not always a bearish signal nor is a reading below 20 bullish. When gauging overbought/oversold I like to pair it with a weekly ATR. If the Stochastic gets above 80 (or below 20) and the range over the past 2 days exceeds the length of an average week range, the market is considered overbought (oversold). Thus, time decay will begin to influence long options.
Combine Overbought/Oversold With Traditional Range
To enhance the strength of a bullish or bearish signal combine the signals with the 20 to 80 thresholds. If the slower Stochastic (%D) is above 80 and the faster Stochastic (%K) crosses below %D the sell signal is generally more reliable. On the other hand, if %D is under 20 and %K crosses above %D a bullish move is probable. When a sell signal is realized it is often more effective if the high of the day is made in the first 60 minutes which is an indication that sellers are in control. Conversely, when the stochastic crosses above the 20 threshold and the low of the day is made in the first hour the signal to get long is typically stronger.
John Seguin, Market Taker Mentoring
