Improve Your Trade Location
One of the more difficult issues traders face is choosing the best prices for entry and exit. Good trade location simply means buying near the low of a move or selling when a rally reaches exhaustion. Identifying the onset of a trend and entering early in the cycle is another form of good location. The earlier you catch a trend risk is mitigated while profit potential increases. Pinpointing daily entry and exit levels, also known as support and resistance areas, requires some technical and fundamental history of the market you are trading.
Charting Tips
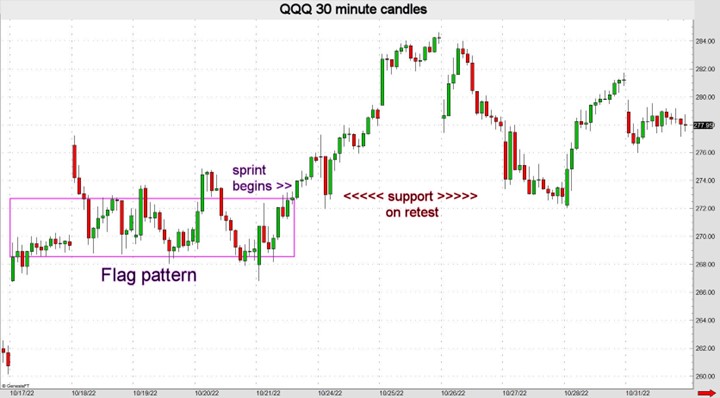
When charting, it is important to label prices where momentum kicks in. The catalyst could be a major fundamental event, or such levels may be technical like breaking out of a flag formation (rectangle) or a pennant pattern (triangle). Big moves often begin as price discovery accelerates and volume rises when breaching trendlines. Acceleration higher or lower typically leaves behind distinct patterns in intraday day charts (30- or 60-minute candlesticks). I call them “sprints” because the market is racing away from fair value and leaving single prints in its wake. Single prints are candles that have little or no overlap with the previous candle. Long body candles with small wicks are common when markets accelerate from congestion patterns.
The graph below shows once the top of the flag pattern is violated it becomes support when retested on two occasions. Tops and bottoms of flag formations typically provide support and resistance when revisited. This is one way to get good trade location.
Top Picking and Bottom Fishing
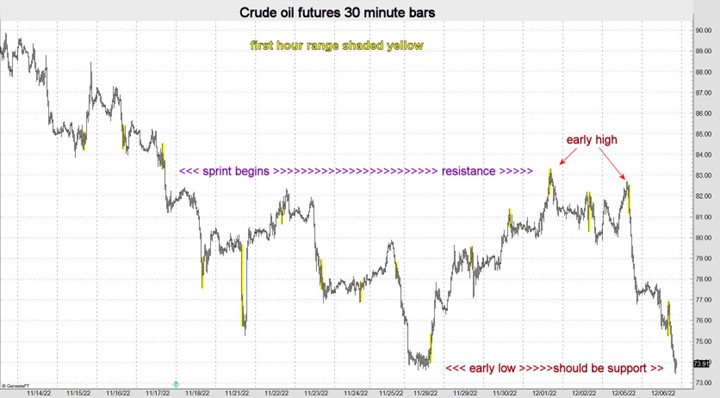
Extremes (high or low) are often made in the first hour of regular trading hours. Such levels frequently provide reversals when retested. Generally, the high volume and most liquid time of the day is the first hour of the day session. One of the most reliable indicators for identifying a change in trend is when the high or low for the session is made in the first 60 minutes of trading. When early extreme prices are tested, they frequently provide support/resistance. Furthermore, when sprints are retested reversals or consolidation phases often ensue.
The oil chart below illustrates these two points. Top picking worked when a previous sprint was tested, and it paid again when the early high was retested. Eventually, oil prices declined to a support zone where an early low was reached. The jury is still out, but bottom fishing often pays when such levels are first tested.
Momentum Begins and Ends at High-Volume Prices
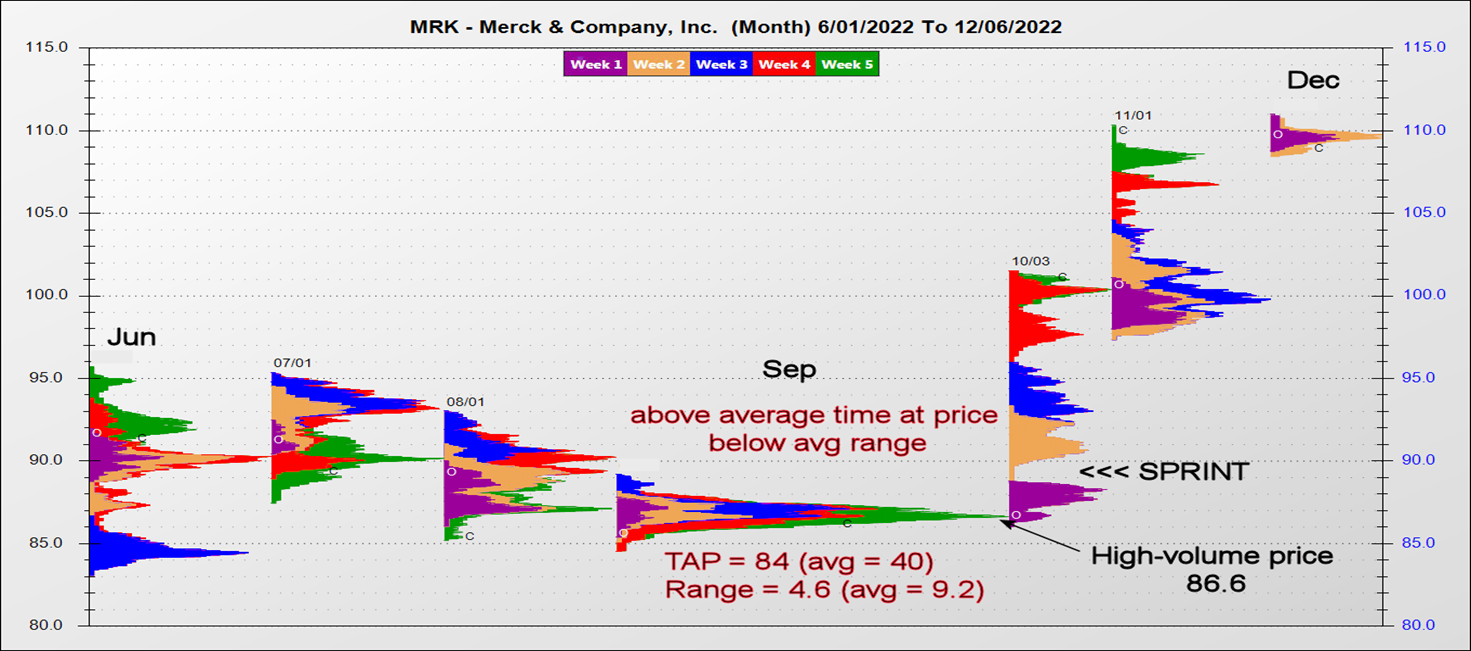
Another breakout pattern is triangular, which often has a noticeable high-volume price. I watch time at price when a market is making a pennant formation. The monthly MRK chart shows the high-volume or fairest price in Sep was 86.6. The time at price (TAP) was more than twice the norm, while the range was half the standard. Big breakouts often occur with this combination. Note that Merck sprinted higher shortly after this triangular pattern took shape. I check charts for old high-volume prices because they are typically barriers when retested. Thus, they usually provide good trade location.
Picking Strikes
To pinpoint extremes, keep track of critical levels where momentum accelerated (sprints). Note highs and lows made in the first hour of the regular trading day. And when old very high-volume prices (congestion areas) are retested, change in trend is common. If you hone your craft for picking support/resistance zones, you will likely improve your ability to pick the best strikes for your option trading.
John Seguin, Market Taker Mentoring
