Enhance Trade Timing with Intraday Direction Indicators
Perfect timing for entering and exiting trades is high on the wish list of every good trader. Early identification of a breakout or trend is known as good trade location. Ideal entry not only increases profit potential, but it also reduces risk. It is important to have short-term or intraday direction indicators that will enhance the timing of a trade.
Pre-trend Phases
There are certain patterns that frequently occur before a trend begins and when one is near exhaustion. Maybe the most prevalent pre-breakout pattern is known as a consolidation phase. Trend potential is high when day ranges and volume dip below average for five to 10 days. These patterns often take the shape of a flag (rectangle) or pennant (triangle). I call congestion zones value areas. Such areas have a lot of overlap in prices over consecutive days and the opens and closes tend to be near each other.
Trend traders get frustrated and often lose money during these phases while counter traders cash in. I like to think of consolidation phases as the time it takes to spring load a market. The more time spent coiling the bigger the vertical move will likely be. I try to view markets as simply as possible. Thus, I categorize markets using just two labels: trend and non-trend. My goal is to catch trends quickly and survive non-trend stages.
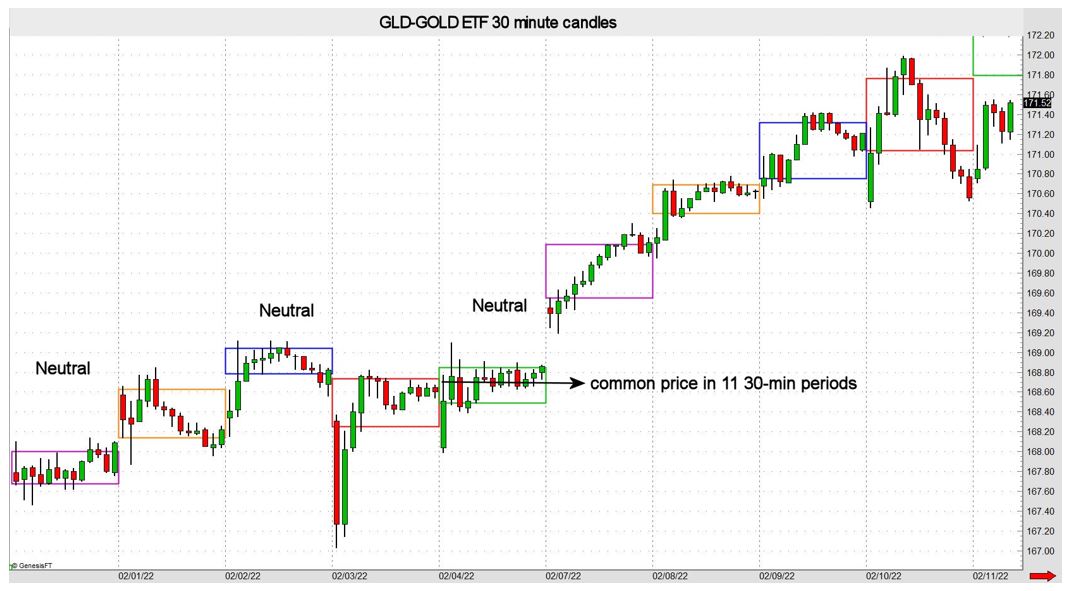
Non-trend or Neutral Days
A non-trend day is common 24 to 48 hours before a breakout ensues. I use a 30-minute candlestick chart to identify neutral days. There are 13 30-minutes periods per day session for most markets. If one common price trades in 11 periods it is considered neutral. Another day type that reveals impartiality requires keeping tracking of the first hour high and low. If both the high and low are violated later in the session it is deemed neutral. Another type of neutral day is when the entire range for the day is set after the first hour of the session. The neutral day types are shown in the chart below just before the gold ETF (GLD) rose sharply.
Breakout Signals
If the factors above take hold, odds increase for an acute vertical move or trend phase. There are a few frequent signs that a trend higher has begun. One, the low for the day is often made in the first 30 minutes of the session. Two, a new high is made after the first 60 minutes of the day. And the 3rd sign that a trend higher may have started occurs when the market closes in the upper quadrant of the day range.
Of course, the opposite is true when a bear market begins. In this case, the high is made early, there is an extension lower after 60 minutes, and the market settles in the lower quadrant of the day range. When these instances occur, chances are the market will continue to move in that direction for days to come.
The ratio of profit potential versus risk improves by early detection. And early detection comes from identifying patterns where probabilities are high for sharp vertical breakouts.
John Seguin, Market Taker Mentoring
