Picking Extremes in Extraordinary Times
A bit more than a few decades back, I read my first book on technical analysis. Over the years I have researched, tested and thrown out many disciplines. However, I always kept a notebook that became a compilation of the best parts of each technical tool and indicator. By doing so I developed my own personal approach using market-generated information (technicals) and fundamentals (forces of supply and demand). A consistent approach or personal checklist allows a trader to react and adjust almost instinctively when volatility and pressure are at excessive levels, as they have been since Covid-19 took hold of the planet.
Over the past few weeks, I have been contacted by some friends and traders who I have not heard from for many months and even years in some cases. Most were looking for guidance while others just wanted to talk. The most popular questions they asked were: Where are support levels for equity indexes? When is it safe to reenter or go long stocks? Where should I put my money or what are the safe havens?
Let’s start with the latter. The only real haven during the past month has been in the fixed income market, particularly U.S. treasuries month or ETFs like IEI, IEF and TLT. Gold tends to rise when there is chaos and conflict, but even this haven fell sharply as many investors sold coins or bars to raise capital, cover margin calls and possibly to hoard toilet tissue.
The question I could not answer is, when will this volatility subside? The extent of the virus is still unknown, so the VIX (so-called fear index) is apt to remain at high levels until Americans receive a piece of the $2 trillion aid package. As for trading or bottom and top picking, I refer to my notebook that has helped me navigate extreme environments throughout the years.
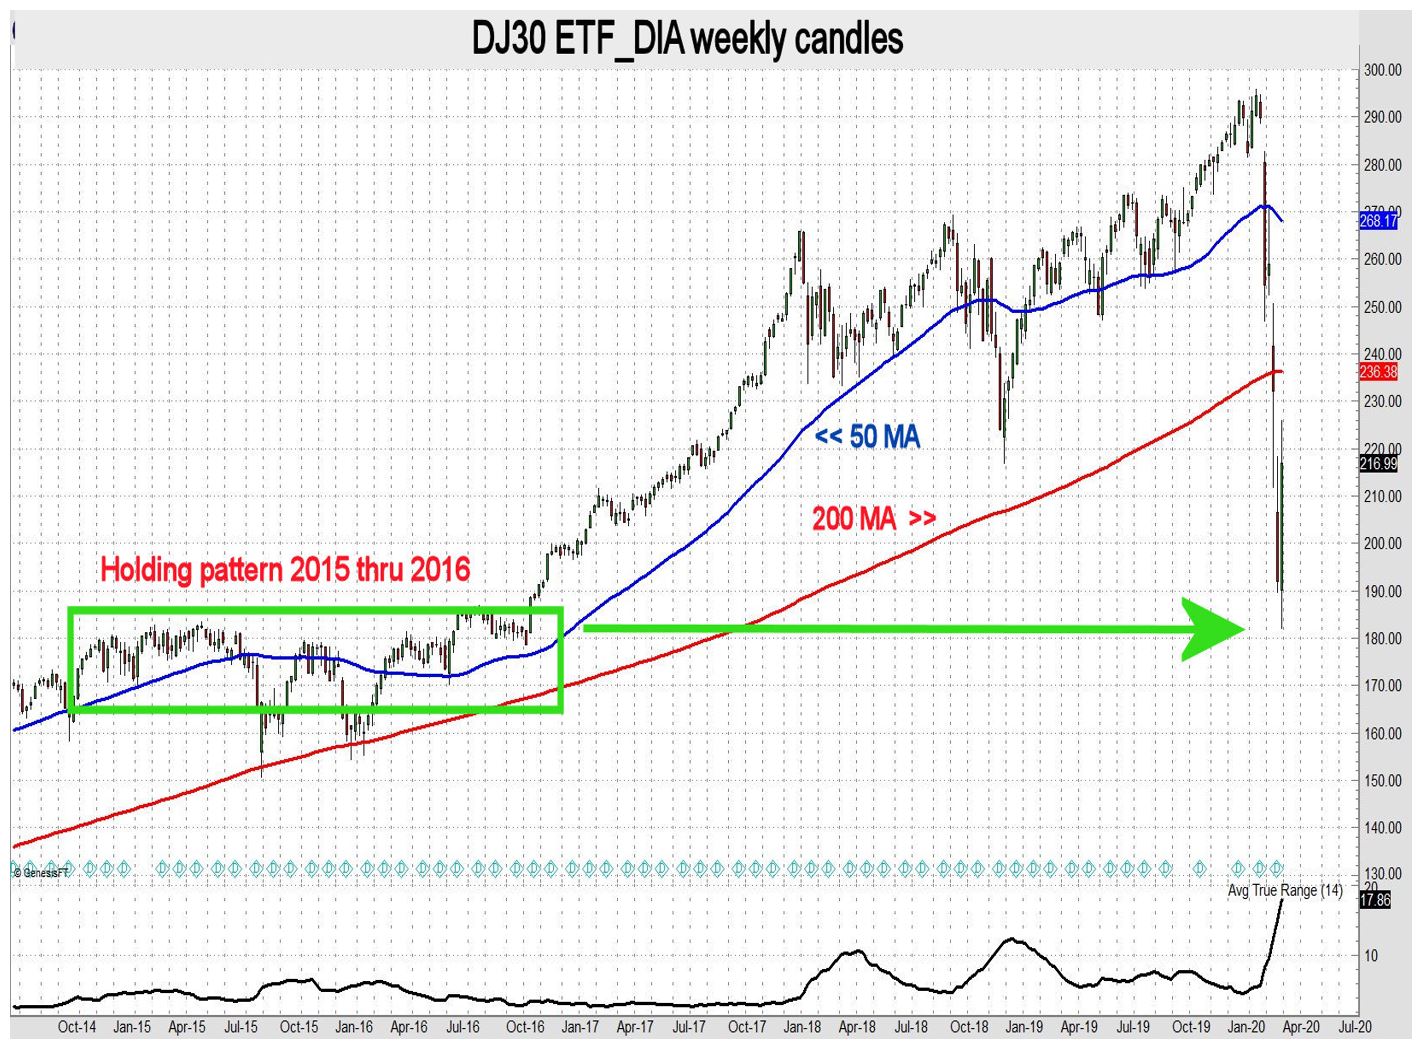
This is the message I relayed to my friends who were curious where support areas are likely to take shape. Markets often reverse or bounce in this case, when an old high concentration zone is retested. It so happens moving averages tend to flatline in such areas as well. The weekly DIA (Dow Jones 30 ETF) graph below illustrates this phenomenon. The sharp decline halted when DIA retested the holding pattern of 2015 and 2016. Also, note that the 50-week MA went horizontal for almost a year. This method of defining support/resistance areas works well for long- and short-term trading strategies.
John Seguin, Market Taker Mentoring
