Use Fundamental Data to Set Risk and Profit Targets
Trade strategies are largely built using pattern detection. Technical analysis is applied to test and design auto-trade systems using mostly price action. This approach pays when outside influences do not disrupt flow. In other words, technicals work sometimes, but the truth is fundamentals move markets.
Fundamental data, also known as “event risk,” make markets move. Trends frequently start and stop when the status quo changes. Every day brings a new challenge. Professional traders keep a close eye on the economic calendar for events or reports that could alter a trend or start new one.
Event Risk
When a scheduled event, like earnings or an employment report, is released, the consensus number or guidance has already been priced in. Therefore, if a report is near expectations, the news should have little or no impact on the markets. It is the difference between actual and consensus estimates that makes markets move.
For example, if an inflation figure is much higher than expected, interest rate sensitive stocks and ETFs would likely drop steeply. This phenomenon occurred this week. On Thursday, March 4, Federal Reserve Chairman Jerome Powell mentioned that inflation is apt to rise as the economy moves toward pre-pandemic levels. This was a fundamental admission from the Fed chief, who has been rather vague and dovish. A dovish stance means monetary policy will remain accommodative thus keeping interest rates at low levels. The opposite is a hawkish stance, which means a higher interest rate policy is needed to cool down an overheated economy.
Powell stated there is the likelihood of an increase in prices as the stimulus package takes hold and vaccines allow the country to reopen fully. The immediate response to this comment was a sharp decline in the major stock indexes and a rise in interest rates (decline in interest rate ETFs and futures). The dollar rose with rates and so did petroleum products and energy sectors stocks.
There were two major events this week. Fed Chief Powell conceded that an uptick inflation is probable later this year, though it should be temporary. The other major event was that OPEC decided to keep production reductions. Many energy stocks and ETFs performed well on this news.
That moment in time when the fundamentals become apparent is integral to setting risk and profits targets. I recommend viewing and marking intraday charts when a market moving event occurs.
Mark Your Chart
Since fundamentals move markets, we need to track when an event has occurred causing price to move abruptly in response. The USO chart below shows when OPEC decided to keep production levels low. The level at which this change occurred is shown in the graph. This is now a critical or pivotal area that should be viewed as support. It can also be used to define risk on long positions.
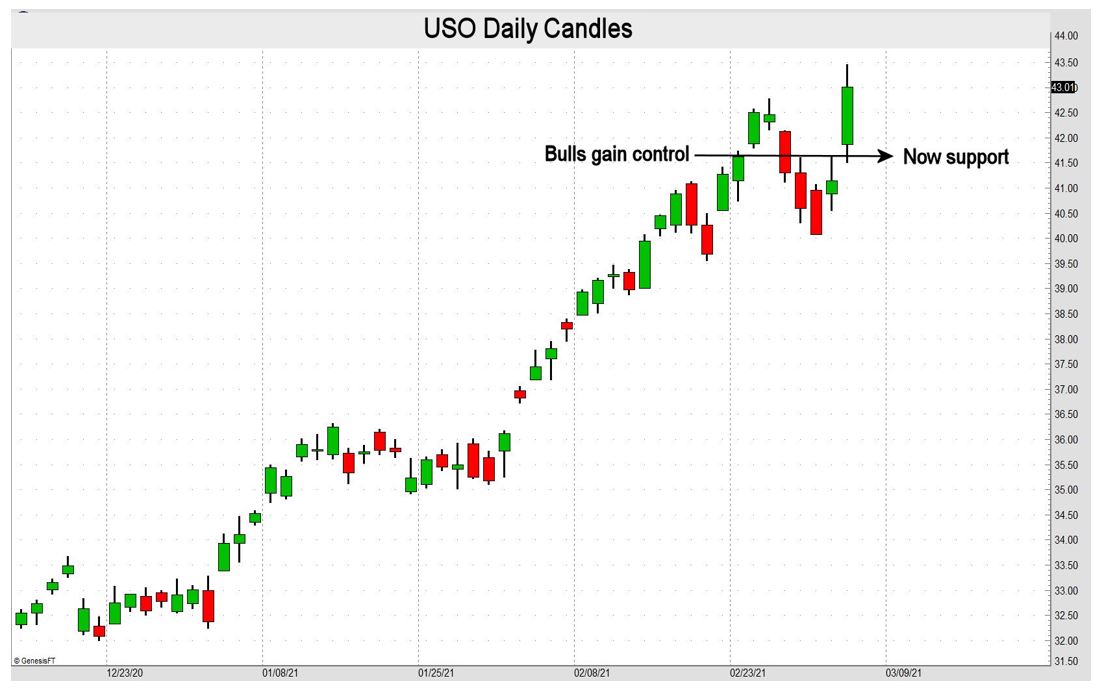
Learn to identify major market moments. The forces of supply and demand are revealed during sharp vertical moves. These areas typically become critical support or resistance levels when retested.
John Seguin, Market Taker Mentoring
