Alleviate Stress With Timing Techniques
In my experience most traders are impatient once they enter a position. We all want our bets to pay quickly because it relieves stress and reduces the time spent questioning the choice. The inner monologue we have gets louder when in a trade. It is often the cause for not following the game plan and making rash decisions. If we can improve the timing for entering a trade just before a breakout occurs, we can alleviate some of the stressors.
Pattern Recognition
The onset of a trend or breakout frequently comes following a consolidation phase or period of choppy trendless trade. Though price action is erratic during this phase, two common patterns often take shape. Triangles (pennants) and rectangles (flags) and variations of the two are the most prolific patterns. Identifying order is the first step to improve the timing of a breakout. When a market penetrates a trend line volume usually increases as the market accelerates in a direction. Candlesticks with long bodies and small wicks while breaking out of a pattern are typically a sign that the move is gaining momentum.
Trade Facilitation
The purpose of markets is to facilitate trade. Consumers (buyers) and producers (sellers) negotiate to find fair value for both. A strong trending market typically has day ranges and volume that are either average or higher than the norm. If volume and daily range size are decreasing, the market is not facilitating trade. In that case a trend will likely stall or reverse, signaling it may be time to exit a position or reduce exposure. Candlesticks with small bodies (similar open and close) are common near the end of trends. A series of small body candles is common just before a breakout occurs.
Measure Congestion Using Time
I had an epiphany in the late eighties while reporting price action in the 30-year bond pit at the CBOT for my firm’s offices in the states and Europe. The markets had been quiet and in consolidation mode for a couple of weeks. I used to do my charting by hand using market profile and noticed the markets were stagnant. In other words, bonds were spending a lot of time at the same prices. When this occurs a normal distribution or bell curve often forms. Then one day many of the top Wall Street firms started buying and the bond rallied sharply for a couple of weeks. It was if someone set off a rocket. I realized that the more time spent at price the more energy builds. Markets accelerate from fair prices.
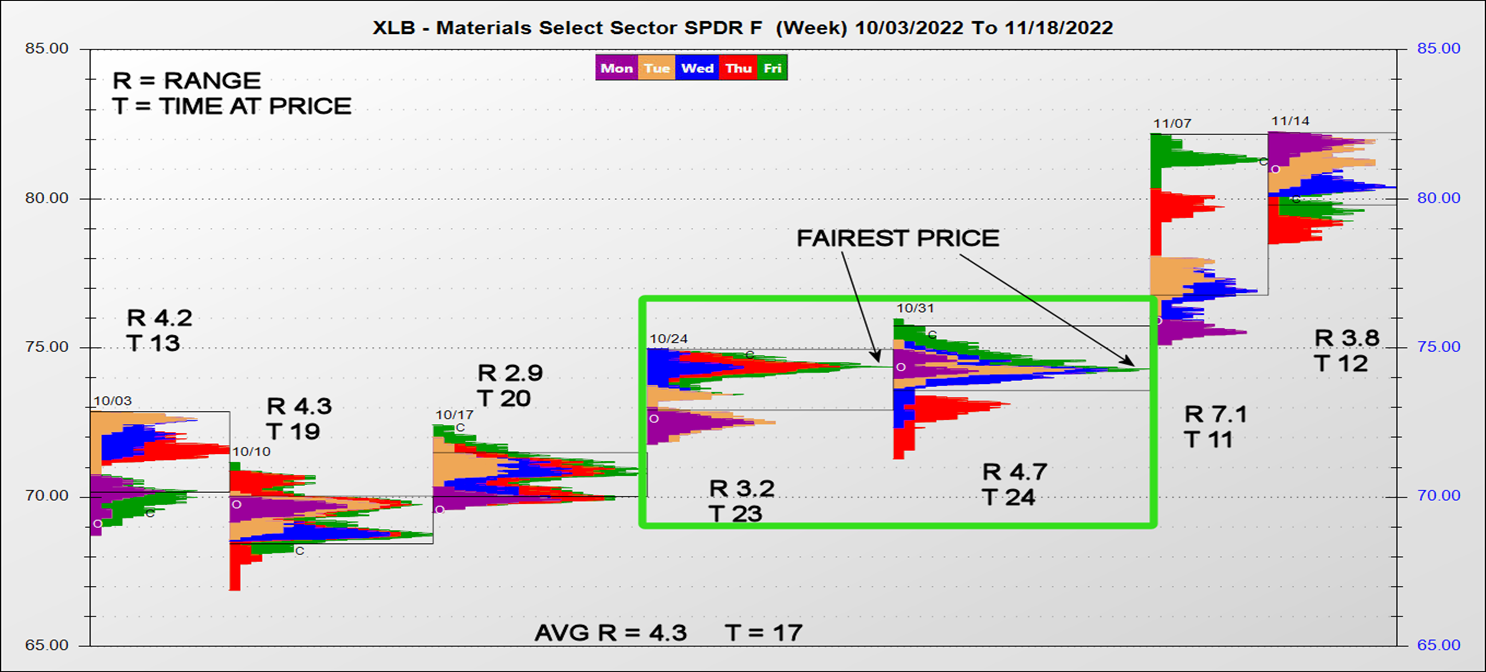
I designed a program that tracks time at price (TAP). The weekly XLB chart below illustrates the dimensions of range and TAP. The fairest price is the one that sticks out the furthest to the right. The two weeks within the box had above average TAP. When I see that pattern, odds for breakout are quite high. Thus, a straddle or strangle purchase should perform well under these conditions. Another way to tell if a market is ripe to break out is to utilize a short-term moving average. For example, if a market is tethered to a five-day MA for a couple of weeks, chances are an acute move is not far off.
John Seguin, Market Taker Mentoring
