How to Scan Markets for Breakout Potential
All traders fantasize about the perfect trade where they enter a position just before the market accelerates in the direction they have chosen. In this dream, risk is never a factor because the trade was never in the red. Such trades do exist, though they are elusive and rare. The trick to catching one is recognizing when probability favors a sharp vertical move.
I often refer to fast vertical moves as breakouts or sprints, because the market is running from a consolidation zone or fair value area. So, we must define what a consolidation phase looks like and when it has matured, making the market ripe to go on a run.
Price action gives us plenty of information to create strategies. There are vertical (high minus low) and horizontal dimensions (volume or time at price) as well as countless technical indicators. One of the most common patterns that form just before breakouts requires organizing price data into bell curves or profiles.
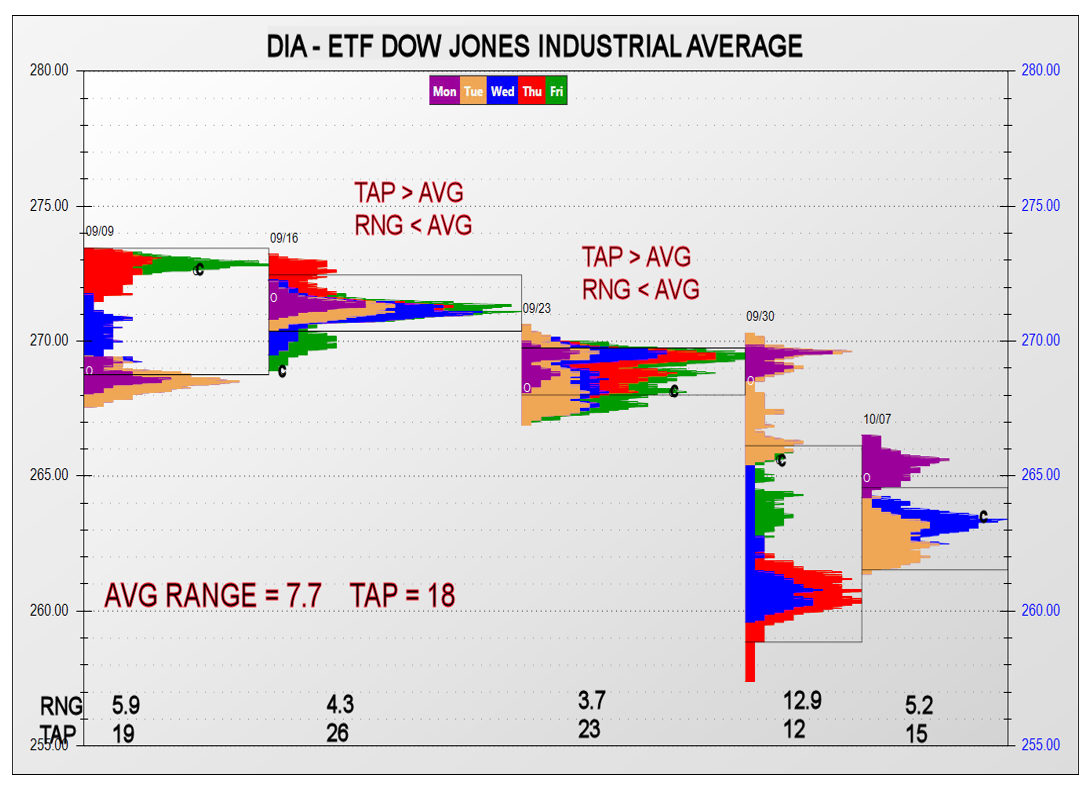
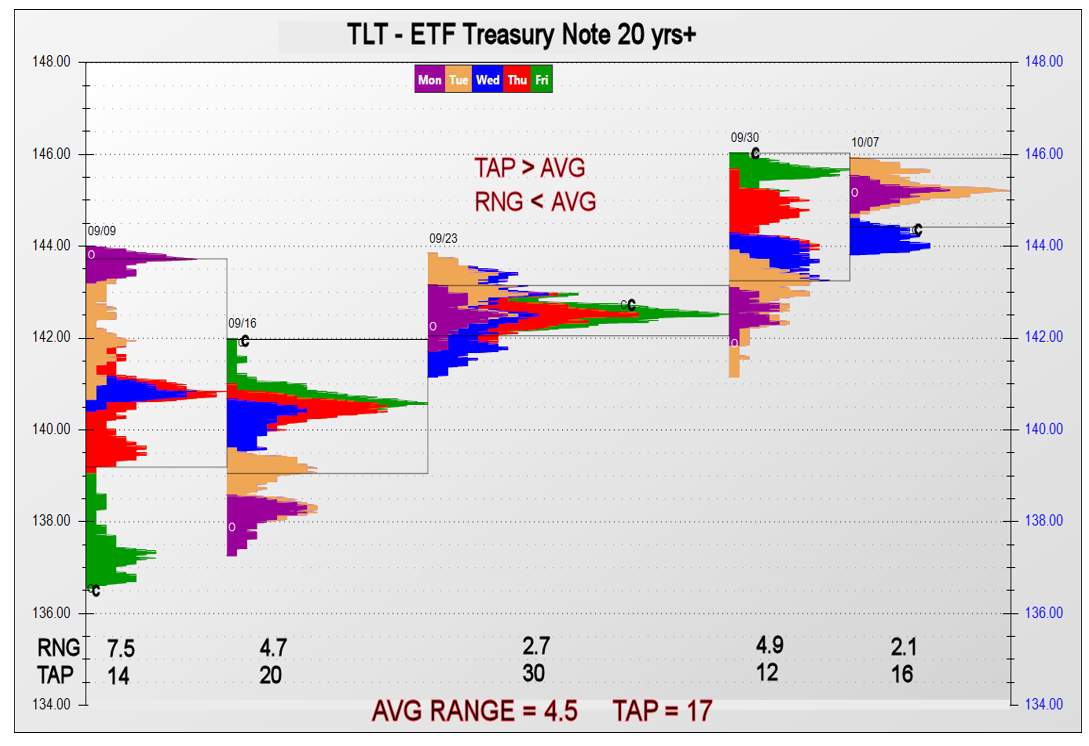
At the bottom of the weekly charts below the vertical dimension is shown as RNG (range) and the horizontal measurement is TAP (time at price). When scanning markets for breakout potential, I use two filters to narrow the list. First, I look for short wide bell curves. These typically have below average RNG and above average TAP and are commonly known as consolidation periods. Consolidation phases are common before and after big moves or trends.
You do not need such charts to identify when a market is ripe to run. But you should scan technical indicators that reveal when the recent ranges are below average. My favorite is average true range (ATR). I also like to look at 60-minute candlesticks over a 5-day window. If the hourly ranges severely overlap and the range over 5 days is at or slightly above the length of an average day, then the market is apt to sprint or trend.
John Seguin, Market Taker Mentoring
