Technical Tools to Fit Your Trading Style
All technical tools and indicators perform at times, but none pay off all the time. The secret to technical analysis is to identify which indicator is appropriate given current market conditions. I have researched many charting techniques, indicators and technical tools in my 30-plus years in the commodity and stock markets. Whenever I come across a setup or pattern that consistently leads to profitable trades, I place it in my journal. This “toolbox” is a collection of my favorite and most reliable indicators from many disciplines. Trial and error facilitated my journey to creating a personal technical style. I categorize the signals into three types of setups: directional, consolidation (neutral) and breakout. The combination of candlesticks and average true range (ATR) as a speed gauge is the most logical tool to begin creating strategies.
Pattern Types
A directional indicator allows a trader to remain in profitable positions during a trend. A consolidation phase frequently occurs when a trend has reached exhaustion. A breakout strategy commonly follows a consolidation phase (series of sessions with below average ranges) and is ideal for timing the start of acute vertical moves.
Directional Candlesticks
Candlesticks are one of the best momentum indicators. They track the distance between the open and close of any time period. The first and last 30 minutes of a trading session tend to have the most volume. These are typically the most liquid times of a trading session. Professional traders tend to be most active during those times. Thus, candles are one of the most reliable directional indicators. Engulfing and hammer candles are two of my favorites.
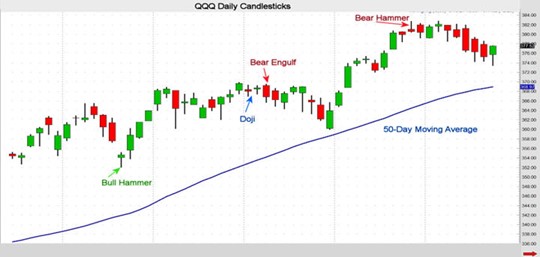
A bear engulfing candle (a.k.a. outside day down) indicates that lower prices are apt to follow. It is a red candle that exceeds both the low and high of the previous candle. Bull engulfing candles work just as well, but the close is higher than the open (green). These candles are common during and at the onset of trends. Engulfing candles tend to be above average in length. Therefore, refer to the ATR. If the engulfing candle is above average the vertical move is often more pronounced and lasts longer.
Another reliable directional candle takes the shape of a hammer. A bear hammer has a long wick from the high and closes very near the open of the candle. This structure often leads to lower prices going forward. Of course, a bull hammer would have a long wick from the low and an open and close that are very near each other. Hammers are common at tops and bottoms of moves. The QQQ chart below shows recent examples of these directional indicators.
Trend Exhaustion and Neutrality
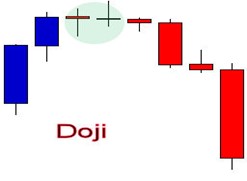
When a trend nears exhaustion or shifts to neutral, volume tends to taper while range length dips below average. Also, the open and close are often very near each other. Such candles are known as dojis. They are common at the end of a trend and a series of them frequently precede breakouts.
Tools to Fit Your Style
To build your own personal trading style search for tools that reveal direction, neutrality and trend potential. If you prefer to short options to collect premium, search for markets that have trended, and neutral candles are forming. On the other hand, if you prefer only vertical or trend trades look for hammers and a series of dojis (similar open and close) because they frequently precede sharp vertical moves.
John Seguin, Market Taker Mentoring
