How to Trade Low Volume Pockets
Most trading systems are developed to capture vertical moves. The most common bullish breakouts occur when the top of a channel (flag) or pennant (triangle) is violated. A bearish trend often begins when the bottom of a flag or pennant is breached. The type of candlestick at the onset of a breakout can be revealing as well. Candles with full bodies and small wicks are an indication of power. Thus, a full-bodied candle passing through a trendline is a great indicator for an upcoming above average vertical move. When a market breaks into a trend it is often fast and furious leaving behind low volume pockets.
Vertical vs. Horizontal Phases
There are many ways to describe the two most popular market phases. The vertical phase may be called a breakout, imbalance, trend, run, rally, dive or dip. A vertical phase can either be bullish or bearish. During the horizontal stage a market is thought to be consolidating, congesting, balancing, coiling, resting or developing value. Rest phases follow run phases, which lead to rest phases and the process repeats.
Leaving Behind Low Volume Zones
When markets break out of consolidation phases they often do so quickly, with above average volume and vertical moves either up or down. Run phases can be violent as the market moves from balance to imbalance. During such moves markets move with time; they do not stop to rest or develop value. While doing so low volume zones or pockets are left in the wake.
Pockets and Puzzle Pieces
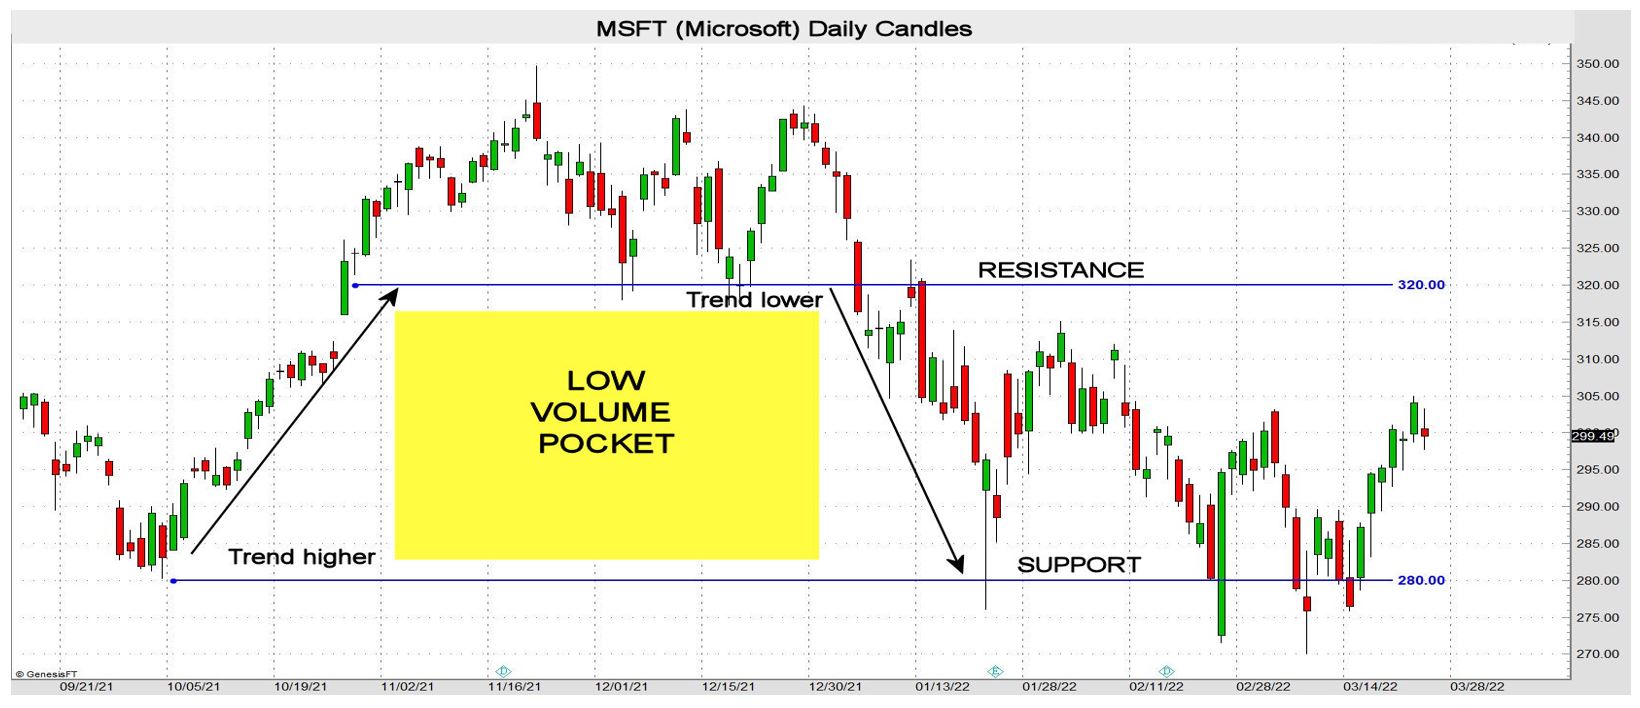
Low volume pockets typically have both a trend higher and lower with candlesticks that usually have long bodies and very little overlap in price. The initial rally and decline define the barriers (support and resistance areas) that will contain most of the volume in the future.
The Microsoft daily chart below illustrates this common pattern. A trend higher began in early October and the price rose to $320. The move was the length of an average quarter ($40) and it happened in about 3 weeks, thus leaving a low volume zone behind. Following a month of choppy trendless trade, a trend lower ensued, again running through the low volume pocket between $320 and $280 at an extraordinary pace. Such low volume areas often become exceptionally high-volume zones. I think of this pattern as a puzzle with pieces missing. A new trend may not commence unless the missing piece (volume) accumulates in the open area or pocket. This low volume area contained more than 95% of the volume (missing piece) over the next 2 months and MSFT is still within those barriers.
Pocket Strategies
Once this pattern is recognized it is time to apply the ideal strategy. A mean reversion strategy works well in this environment. Simply wait until the market tests the support area, and either buy the underlying, buy calls or sell puts depending on volatility; or sell the underlying, purchase puts or write calls when the resistance area is tested. This pattern is ideal for neutral option strategies such as an iron condors and butterflies using support and resistance as the wings or the difference between the 2 strikes as the body.
Rather than apply your favorite strategy on any pattern, it is better to identify the pattern and apply the best tactic.
John Seguin, Market Taker Mentoring
