How to Save Time Scanning Market Patterns
Just about everything can be quantified and bought and sold. One thing we can’t buy is time, although we can save it. For traders, time is a huge factor. There is the time frame an investor prefers to trade or hold onto a position, intraday, day, week, etc. And there is the time it takes to scan markets for patterns that suit the trader’s strategy or style. Since the time we spend searching for ideal trade setups cannot be recovered, we need to find a way to shorten that task so we can spend more time with family and friends or leisure and hobbies.
There is an exercise we practice in futures class that helps us speed up the process of selecting stocks or commodities with a high probability of trending. At the same time we have a method of scanning the markets for patterns that precede consolidation phases or periods where selling premium may be a better approach.
The first step to becoming a time saver is to calculate the two benchmark dimensions you will need to compare with current price action. The most common dimension is vertical range and the horizontal dimension is time at price.
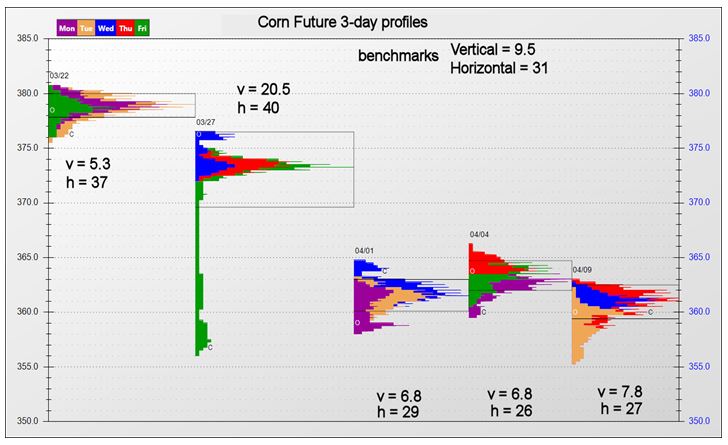
For this example, let’s take a swing trader view using three- and six-day charts. Macrographs illustrate the vital statistics we need for quick scanning. When I generate these charts, I focus on just two patterns. The vertical (V) or overbought/signal, which favors a short premium strategy, and the horizontal (H) measurement that indicates when a market is ripe to trend.
In the corn example below, notice that H was well above the benchmark before the steep decline. And after the above average vertical move a consolidation phase ensued where a short premium strategy would likely pay.
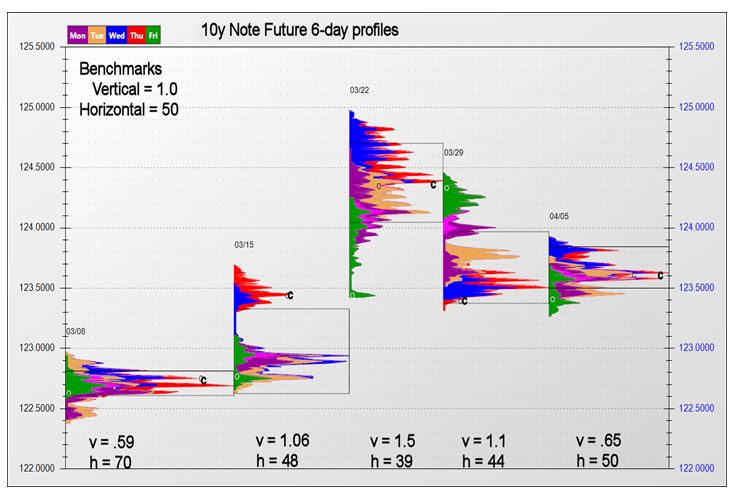
In the 10y note chart below we apply the same scanning rules. If H is above average and V is below average, odds increase for a sharp vertical move. On the other hand, when V is above the benchmark and H is below the norm, a period of consolidation followed.
My favorite time frame when trading futures is about a week. So, I look at three- and six-day profiles for ideal setups. If you prefer a longer-term trade, say a month, you should search for patterns in 10- and 20-day profiles.
John Seguin, Market Taker Mentoring
