Recognizing Change in Trend
Timing the end or reversal of a trend is a difficult task and the ambition for most traders. There are a few patterns that recur when a trend is nearing an end.
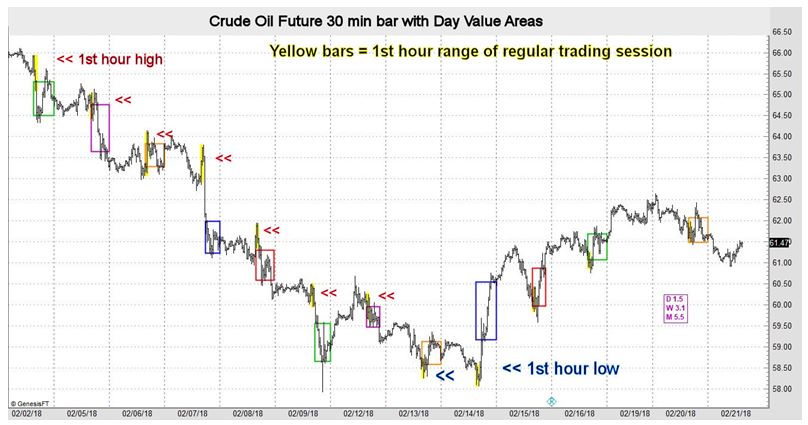
When a market is trending higher, the low for the day is frequently made very early in the session, often within the first hour of trading. Conversely, when the trend is down, the high for the day is often seen early in the session. So, if a market is trending lower and the high for the day is made in the first hour, chances are that trend will continue to extend down. When we begin to see lows made in the initial hour, it is an indication that the trend is near an end. The crude oil chart below illustrates this point. Notice during the trend lower the highs are being made very early in the day session. And when the trend ends, the lows are made near the start of regular trading hours.
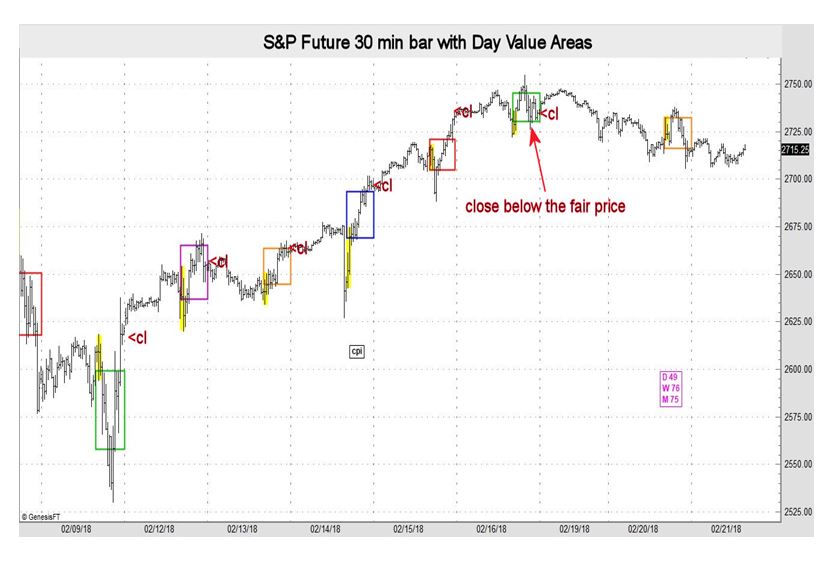
There is another common occurrence that reveals a trend may be nearing an end. As a market trends down, daily closes tend to be below the high-volume or fairest prices of the day. And, of course, as a market trends higher the settles are frequently above the fairest prices of the day.
Near the end of a trend, the opposite action often occurs. When tops form, closes tend to be below the high-volume prices. On the other hand, bottoms tend to form when we start to see closes above fair prices. The S&P chart below displays this phenomenon. Note that during the rise the closes were above the fair value area (color coded rectangles) and the lows were made early in the day session. The trend stalled out following a settle below the fairest price of the day. This method of tracking momentum is similar to candlesticks, though it may be a more reliable indicator because we track the close relative to the fair price not the open. After all, momentum begins as a market leaves a fair price.
John Seguin, Market Taker Mentoring
