How to Track Financial Market Correlations
Trading financial futures has been a tough task lately. The equity indexes have done well recently, but they have spent most of the past five months chopping around in the range that was established over two days back in early February. Treasuries have been stagnant, while precious metals have been trending lower and the dollar higher.
At times the relationship between these sectors is not apparent. However, a sharp move in one commodity may renew or reveal a relationship with another sector. In Futures Group Coaching class, we track correlations between many markets and different time frames. For example, a gold trader may refer to Japanese yen or dollar index to time the start of a trend or possibly the end of one. And a forex trader may use interest rate futures as a timing mechanism to enter or exit a currency trade.
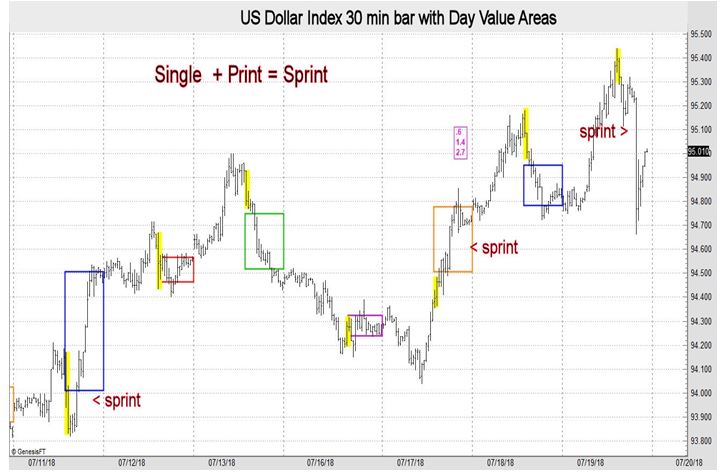
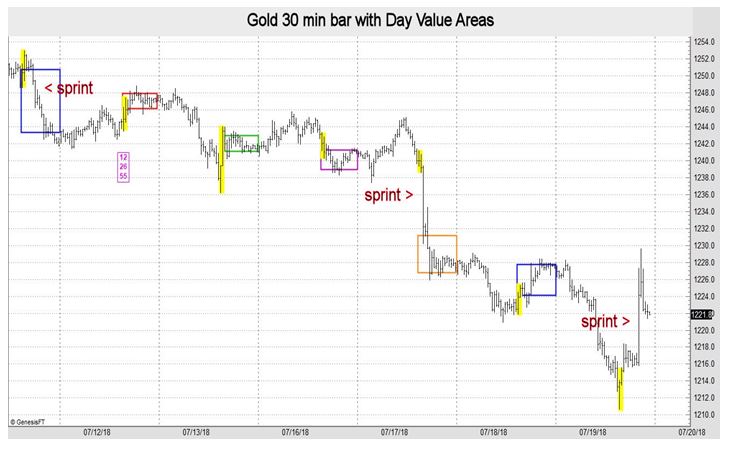
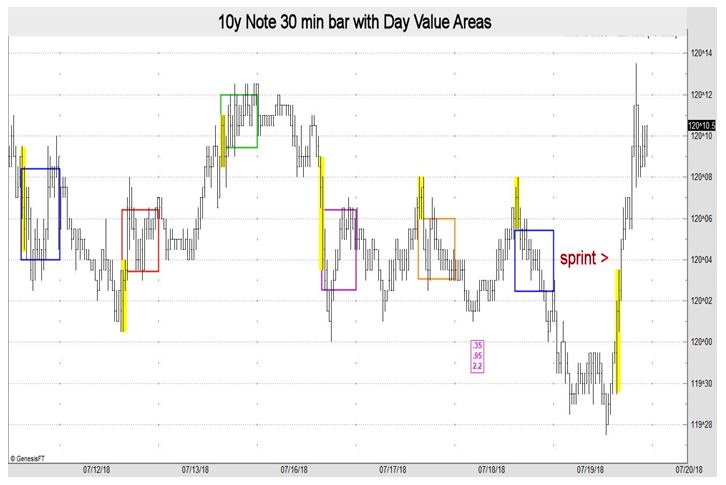
A short-term 30-minute bar chart is sufficient for recognizing correlations early. “Sprint” is short for single print and is a term I use to describe a violent thrust higher or lower in price. When markets accelerate in a direction, they leave behind sprints, which are common at the onset of trends.
Recently there was a sprint higher in gold and silver. At the same time the dollar sprinted lower, and the euro and yen raced higher. Treasury futures accelerated higher as well.
So here is the current financial correlation equation: Treasury notes = gold = euro = yen ≠ US dollar. The equity indexes did not respond to the sharp moves in the other sectors.
The charts below display sprints occurring at the same time but in different directions. Thus, correlations become clear. Sometimes a market may start in a direction but the correlating market lags. View this as an opportunity to enhance timing the entry of a directional trade. The earlier you catch a trend, the less risk you take and the more profit potential rises.
John Seguin, Market Taker Mentoring
