Find Order in Chaos
Too often price action is difficult to discern as we search for clues for a directional trade. Traders frequently rely on very short-term signals to make wagers. But short-term price action is often erratic making it tough to choose if bulls or bears are the dominant force. For this reason, it is imperative to step back and take a longer-term look using charts. Markets extend and contract, that is what they do. In other words, they trend and consolidate. Erratic trade often occurs after an above average vertical move, and trends frequently begin after an extended period of consolidation. This phenomenon is illustrated in the 10y note chart below.
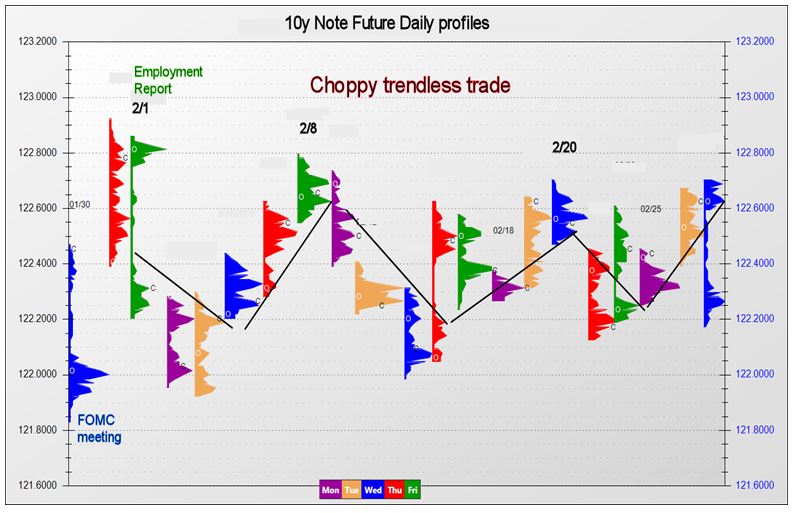
The macrograph below shows interest rate futures (10y note) price action in February. During this consolidation phase there were short-term runs that lasted a few days before reversing. Trend traders would struggle in this environment, and mean reversion or contrarian traders would usually excel.
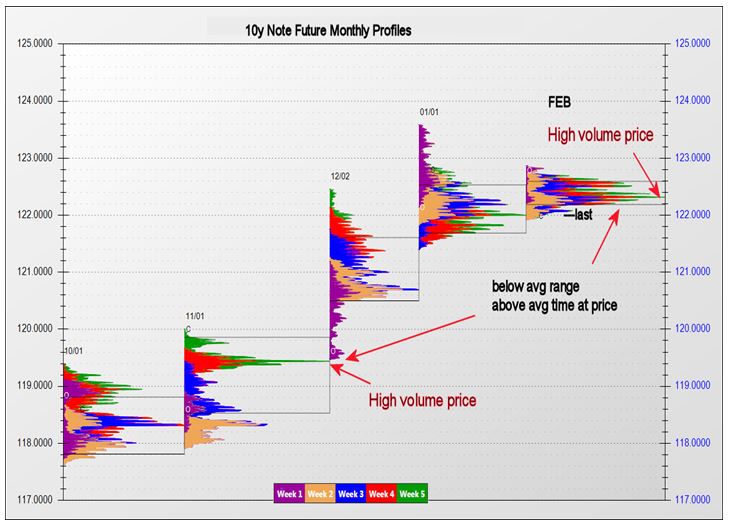
If we organize the data into a longer-term structure a fair price is often revealed. A view from afar is best when the near-term momentum indicators shift often. Trends frequently start after a fair price has developed, and this is obvious in the second chart.
The second chart displays price action like the chart above but from a monthly time frame. A normal bell curve or symmetrical profile formed during the choppy trendless consolidation phase in February. It showed us order in chaos. This charting method is a derivative of market profile. It reveals a high-volume price and with that a fair value area takes shape. When the vertical range (high minus low) is below average and the time at price is above average, trends frequently follow. Traders try to catch trends. To increase the odds of catching one, expand your time frame. Organize data in different time frames to enhance the timing of catching a vertical move.
John Seguin, Market Taker Mentoring
