Correlations and Trade Timing
Capital markets and commodities are tied together through capital flows. Money moves in and out of asset classes in somewhat predictable ways. Part of the trading game involves figuring out what the current relationships consist of. Another part of trading is figuring out when those relationships break down or change.
There are many ways to track these correlations or non-correlations. Some traders or firms spend large sums of money tracking the way markets move in relationship to one another. They utilize computing power and high level mathematics to hone their strategies. Many of these strategies revolve around micro structures, bids and offers on very short time frames, in related markets. Speed to market and trading costs play a role for these entities. Firms can trade tens or hundreds of thousands of contracts or shares in a single day.
This may sound like smaller traders may have a problem if they are competing in an environment described above. The reality is, they are not at any disadvantage. Where smaller traders can utilize some discretion is through some simple observations regarding the markets or shares they trade.
By recognizing themes and correlations in connected markets we can trade with more confidence. Let us look at some examples of the types of themes or patterns we can use in our trading.
Below is a chart of the E-mini S&P 500, the E-mini NASDAQ and the E-mini Dow. The charts are of a short timeframe; one minute. Observe how many of the turning points are made at times and levels when one of the indexes was not participating in new highs or lows for the day. That is one market makes a lower low for the session and the others do not. The first failure is seen when the lower pane, the E-mini Dow, runs up to new highs and the other markets do not. That marks a critical turning point on this timeframe. The non-conformation sent a warning signal that all may not be well with this rally. We can see a similar phenomenon on the lows. In this case, the NASDAQ made new lows but the S&P and Dow did not. We saw a reversal from that point. Lastly, the upside became limited when the Dow, lower pane, showed weakness by not registering new highs along with the S&P and NASDAQ.
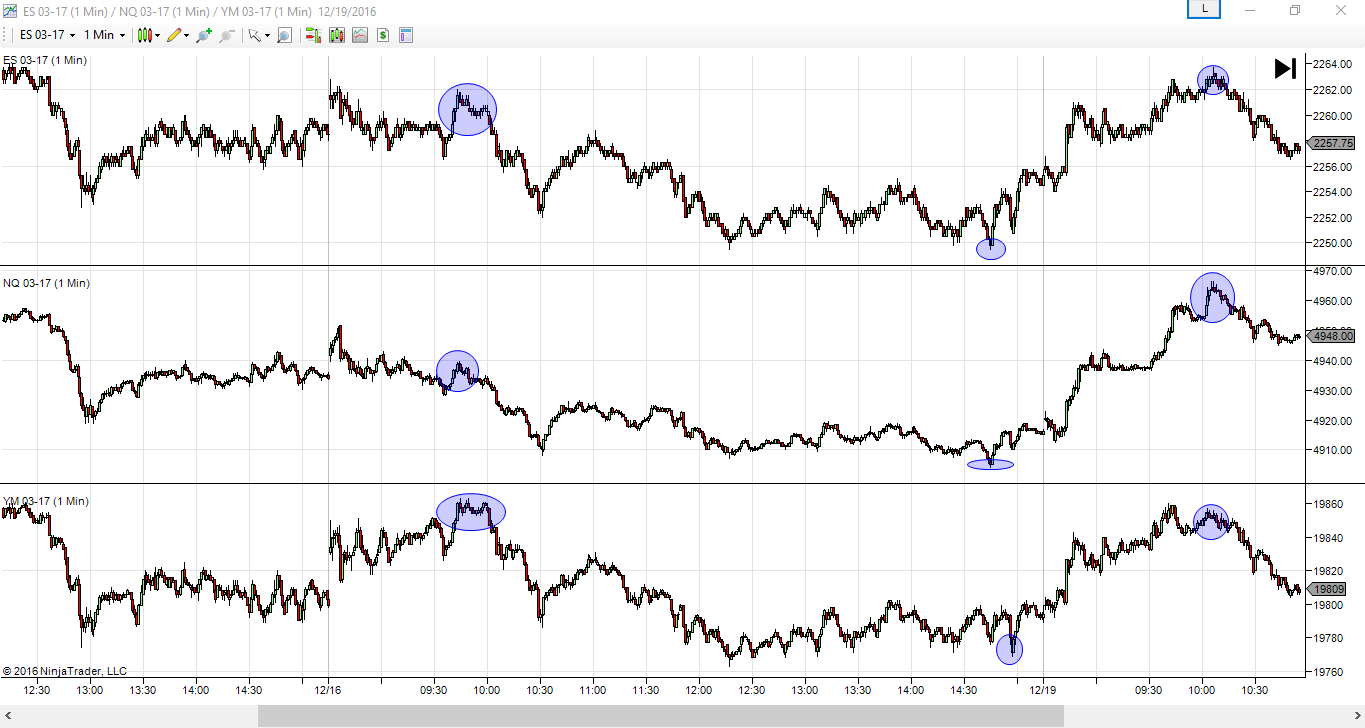
The observations here can be made by any astute trader. The key is to get an understanding of the way closely related markets behave in regards to one another. There is no need for in depth number crunching and sophisticated math. Simple empirical evidence can go a long way in helping traders further their understanding of the markets they trade.
Again, the value in this comes from building confidence and gaining a greater understanding of the mechanisms driving related markets. Using cross market analysis to time trades or to give you a heads up when dynamics may be changing, can be a worthwhile use of time and energy.
Craig Garbie, Contributor
