Average vs. Median Ranges in Volatile Times
When entering a trade, one must consider return objectives and how they relate to risk. There are many ways to project profit, but one of the most logical is to use average true range (ATR) over various time frames (day, week, month).
For example, assume a short-term strategy has given signal to buy. After entering the trade, the next steps are to define risk and then project profit potential. From the entry point, let’s say risk (stop loss) is set at 50% of an average day range below the entry price. And the first profit target would measure 100% of an average day range above the entry price. This simple strategy may prove useless if volatility jumps drastically and the current ranges become much larger than the recent sample. By using the previous smaller ATR during extremely volatile sessions there is a good chance of being stopped out often because the risk was not adjusted to the new larger ranges.
In early February stock indexes suffered a hasty and historical correction. The decline was fast and furious with day ranges that exceeded the length of an average week. After 10 days of mammoth moves both up and down, the ATR saw a dramatic rise. The new average was three times the previous norm. Now profit potential has tripled, but so has risk. The problem here is that it took many days for the ATR (20 day) to catch up to current ranges.
When volatility jumps violently it may be best to use a median measurement of recent ranges in lieu of ATR. In this way profit projections are more attainable, and risk will be at an equivalent percentage. Eventually, the ranges will come back to normal levels and the ATR should be the benchmark again.
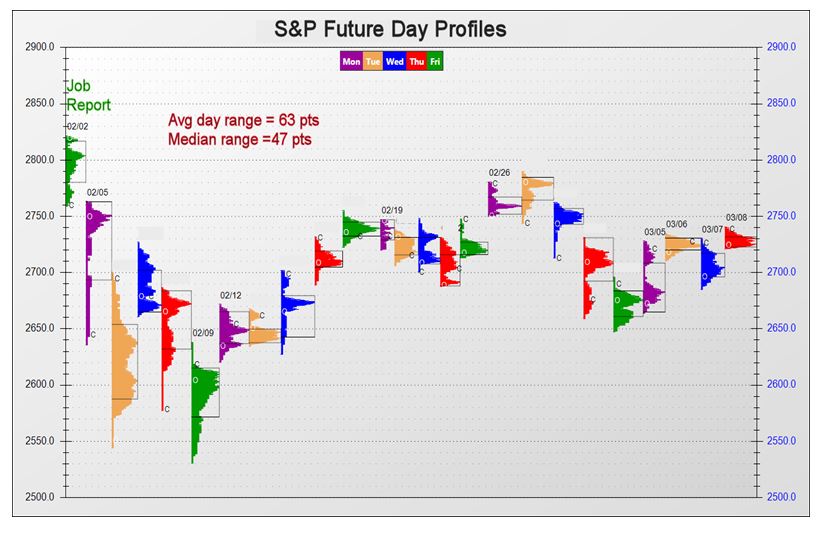
The chart below shows the difference in S&P futures daily ATR and median measurement during the volatile month of February. Note how the ranges decrease to normal sizes as time passes.
John Seguin, Market Taker Mentoring
