Use Dimensions for Timing Breakouts and Setting Targets
A couple of times a month I update a spreadsheet filled with dimension data. The most useful spreadsheet I generate consists of recent average ranges and benchmark ranges for stocks, ETFs and commodities. Most charting platforms have the ATR (Average True Range) indicator. Average ranges are vertical measurements and are valuable because they improve our ability to set profit targets and define risk over various time frames. Furthermore, a comparison of near- and long-term benchmarks can be used to determine if volatility is rich or cheap. The horizontal dimension is calculated by measuring time at price. Time at price is a proxy for volume and is used to identify trend potential. Above average time at price frequently precedes acute vertical moves or trends.
Vertical Dimension
One reason for comparing historic and current data is to identify trend potential. When recent day and week ranges are far below the benchmark (long-term average), odds increase for a breakout or onset of a trend. Under these circumstances buying options and/or debit spreads tend to be effective strategies. On the other hand, when recent ranges are far above the long-term standard, a consolidation phase typically follows. Thus, selling premium or executing credit spreads tend to be a better approach.
Once a trend or breakout begins, we need to project how far the market will travel and how long it will take. I frequently use ATRs to set targets over various time frames. For example, assume a market has been in a tight range for five sessions. Let us also assume volume has been below average and the day ranges are lower than standard. Furthermore, if the daily opens and closes are similar (small candle bodies), probability favors a sharp vertical move. Straddle purchase should pay under these conditions.
Horizontal Dimension
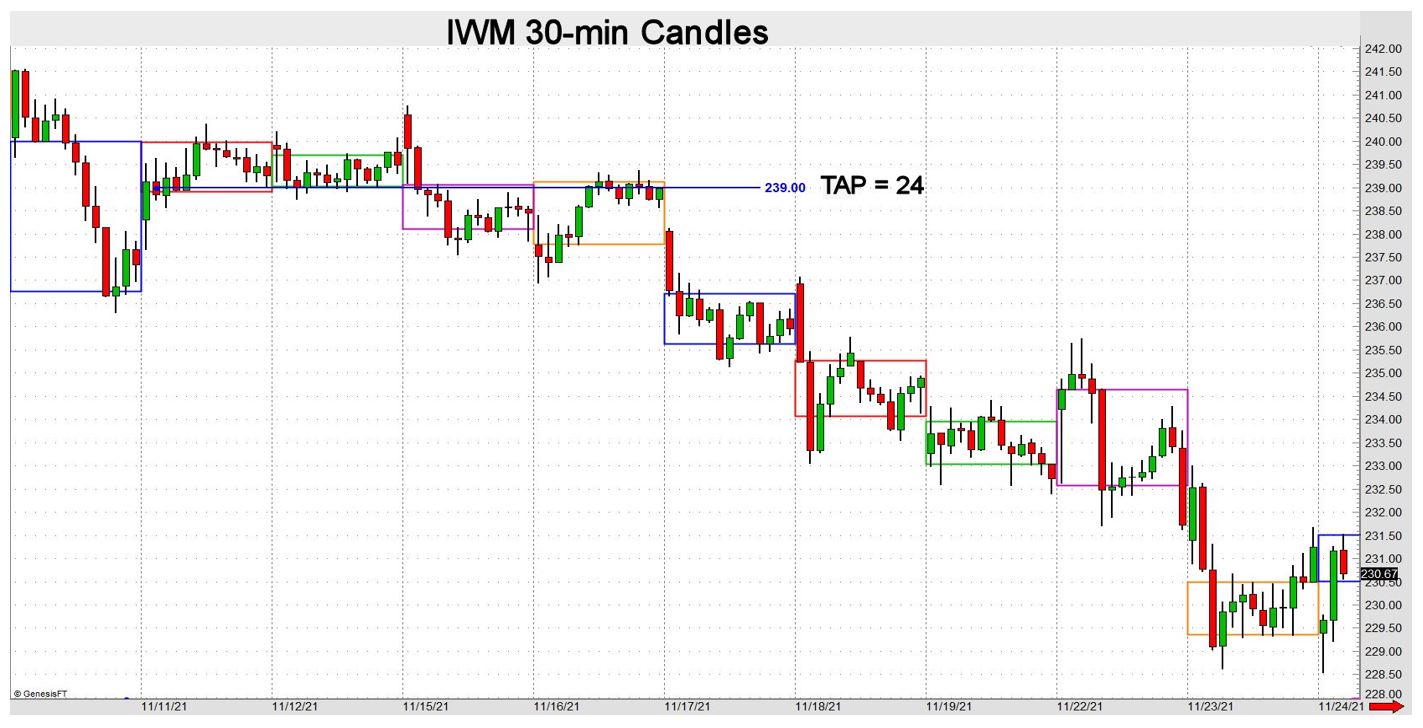
Time at price is difficult to define but integral when attempting to recognize trend potential. Simply, it is a count of price overlap using 30-minute bars. For most stocks and ETFs an average weekly measure of time at price (TAP) is about 17. The price that registers the highest TAP is deemed the fairest price. When the weekly TAP exceeds the norm in less than five sessions, odds for an above average vertical move improve. The IWM chart below illustrates this phenomenon. Too much time at price preceded a sharp move lower.
Use ATR to Set Targets
Here are some basic rules for creating profit targets. When the direction of a breakout is recognized, the next step after entry is to set risk, then project profit targets using ATR. One method I use is to set the first target to be the length of an average day. Target 2 is the length of an average week, and an average month range would be target 3.
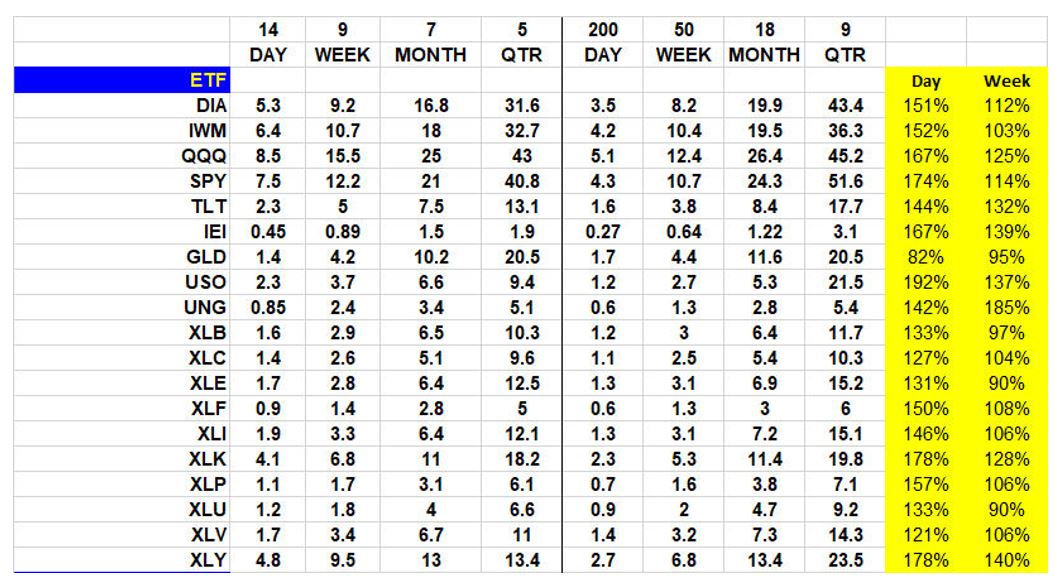
The ATRs I prefer for comparisons are shown in the spreadsheet below.
14 days vs. 200
9 weeks vs. 50
7 months vs. 18
5 quarters vs. 9
Find time for research to create your own spreadsheet of average ranges of your favorite stocks or commodities. A good trader prepares and has pertinent data available to set risk and targets immediately after a position has been entered. To get you started see the recent ranges for some popular ETFs. The yellow-shaded columns show current ranges versus long-term benchmarks. Recent day and week ranges are far above average. Hence credit spreads should pay better than debit spreads.
John Seguin, Market Taker Mentoring
