Focus on the Appropriate Moving Averages
In my experience futures traders tend to be short-term oriented, opting to hold trades for hours to a few days. Equity market traders tend to trade for longer time frames. One reason futures traders are more speculative may be due to margin requirements, which are often a drain on smaller trading accounts. As a result, they often flatten all positions before the close each day. Most of my trades in the futures market are intended to be speculative, meaning I will be out of the position within 24 hours or even by the end of a trading session. Generally, stock market traders and investors plan to hang onto trades for days and often weeks or more. Thus, it is important to choose technical indicators that are appropriate to your time frame.
Standard Moving Averages
Trading style and the technical tools you choose differ depending on the time frame you prefer. Equity market traders/investors and business media generally focus on the industry standard moving averages of 50 and 200 days. However, if you are a swing (week or 2) or day trader those long-term averages are often ineffective when creating strategy.
Time Dictates Indicators
Time is a forcing point. As a broker and educator, I find many of my clients speak of trade in terms of time. Some might say “I had a great day or bad week,” or “trade has been difficult this month,” or “I need a good quarter.” The time you put in watching price action and charts dictates the moving averages you should use.
Moving Averages for Swing Traders
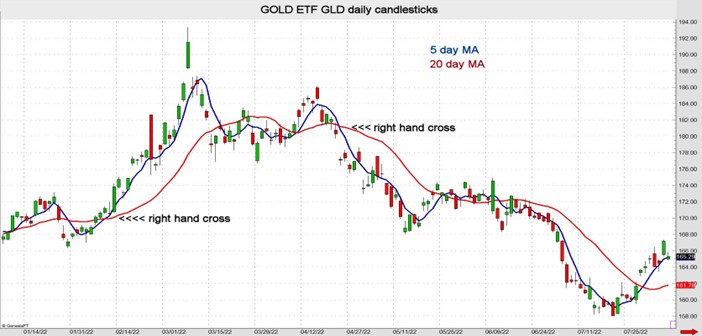
When looking to take a longer-term position or swing trade, the most logical short-term moving average should cover the amount of time you plan to hold the position. For a swing trade, I prefer to use a 5-day MA with a 20-day MA. The logic is that they cover a week and month of price action. When the 5-day crosses above the 20-day, it signals bulls have taken control of momentum. When the 5D crosses below the 20D, bears have gained the edge. When the 5D crosses on the right side of the peak or trough of the 20D, the signal is typically more reliable. The chart below illustrates these MAs at work. There are 5 sessions a week and about 20 in a month. Assuming time is a forcing point, it seems logical to watch MAs that suit pertinent time frames.
Day Trading MAs
When day trading, I like to use 30-minute bar charts. There are roughly 14 30-minute periods during a regular trading day depending on the commodity or stock. So, for intraday directional signals I prefer a 9-period vs. 14-period moving average (30-minute bars) cross over for short-term directional signals.
Helpful Hints
Moving averages are lagging indicators and should be partnered with other tools such as RSI, Stochastics or MACD. Another helpful hint when using MAs is to calculate the difference between the two. When the difference between the averages is below a benchmark, odds for a trend or breakout increase. Thus, buying options might be the best choice. On the other hand, when the divergence of the averages is well above a historic average, chances are the trend is near an exhaustion. In this situation, credit spreads may be the better bet.
John Seguin, Market Taker Mentoring
