Finding the Ideal Trade Location
Perfect timing when entering and exiting trades is every trader’s dream. Early recognition of a breakout or onset of a trend is key to attaining the ideal trade location. Early entry not only increases profit potential, but it also reduces risk. It is vital to employ short-term or intraday direction indicators that will enhance the timing of a trade.
Pre-trend Phases
There are patterns that frequently occur before a trend begins and when it is near exhaustion. Maybe the most prevalent pre-breakout pattern is known as a consolidation phase. Trend potential is high when day ranges and volume dip below average for three to six days. These patterns often take the shape of a flag (rectangle) or pennant (triangle). These congestion zones may be deemed as fair value areas. Such areas contain most of the volume and have a lot of price overlap over several days. In addition, the opens and closes tend to be near each other. Trend traders get frustrated and often lose money during congestion phases while counter trend traders cash in.
I think of consolidation phases as the time it takes to spring load a market. The more time spent coiling, the greater the vertical move will likely be. I break down market movement as simply as possible. Thus, I categorize markets using just two labels: trend and non-trend. The goal is to catch trends quickly and survive non-trend stages.
Non-trend or Neutral Days
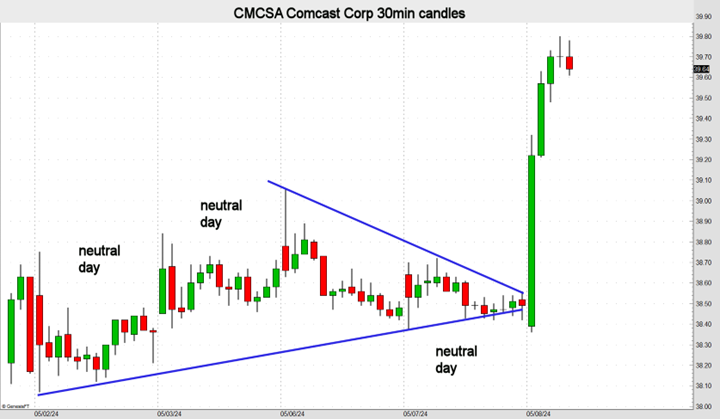
A series of neutral or non-trend days are common before a breakout arises. I use a 30-minute candlestick chart to identify neutral days. There are about 13 30-minute periods per day session for most markets. If one common price trades in 11 or more 30-minute periods it is an indication of neutrality. Another day type that reveals impartiality requires monitoring the first hour high and low. If both the high and low are breached later in the day, it is deemed neutral. Another type of neutral day is when the entire range for the day is set during the first 60 minutes of the session. The chart below shows some neutral activity before Comcast accelerated higher.
Breakout Signals
When neutrality sets in, odds increase for an acute vertical move or trend phase. There are several reliable signs that indicate a trend higher has commenced. One, the low for the day is often made in the first 30 minutes of the session. Two, a new high is made after the first 60 minutes of the day. Three, the close for the day is often in the upper quadrant of the day range. And of course, the opposite is true when a bear market begins. In this case, the high is made early, there is an extension lower after 60 minutes, and the market settles in the lower quadrant of the day range. When these instances occur, chances are the market will continue to move in that direction for days to come.
The ratio of profit potential vs. risk improves by early detection. And early detection comes from identifying patterns where probabilities are high for sharp vertical breakouts.
John Seguin, Market Taker Mentoring
