Using Fair Value as a Trade Foundation
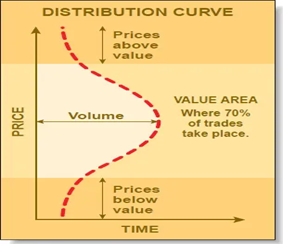
My journey to become a broker/trader at the Chicago Board of Trade began in the mid-1980s. I researched many technical tools and indicators while also exploring the fundamentals that move markets. The charting tool that made the most sense to me is called Market Profile. It organizes price action into a bell curve, which reveals a fair value area. In my opinion, a value area is the most logical foundation for creating trading strategies.
Constructing Market Profile
The tool tracks time at price using 30-minute periods. Each period is assigned a letter, and when piled on top of each other a bell curve or market profile forms (see fig. 1 and 2). By stacking the letters a new dimension is revealed. The horizontal measurement counts time at price. Time + Price = Value.
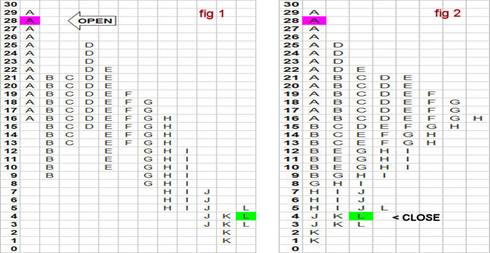
The high-volume price is simply that price where buyers and sellers transact most often. Time at this popular price allows volume to accumulate with each transaction. Therefore, we can use time as a proxy to measure volume. Many data providers and platforms show real-time volume at price, but for this case time will suffice.
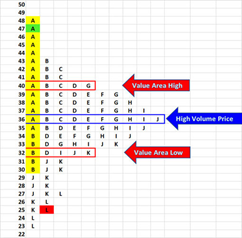
This structure allows the user to determine fair value. The high-volume price is also known as the “point of control.” It is the price that has traded in more 30-minute periods than any other. From that point of control, we can construct a fair value area, which is one standard deviation of volume around the mode. It covers roughly 70% of the volume around the high-volume price. Generally, any price that has 4 to 5 letters in the day profile holds value. The profile below is a normal distribution. Not all days form normal bell curves, but most do.
Value Area Is the Cornerstone
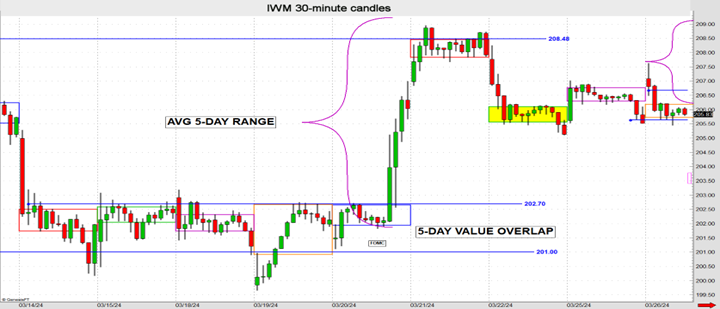
Near-term momentum is defined as the movement away from a daily fair value area. In fact, there appears to be a relationship between the amount of time at price and the length of a rise or fall in price. For example, assume there is value area overlap for 5 consecutive sessions. When the breakout occurs use a 5-day average true range to project profit potential. The IWM 30-minute charts show value area overlap and an explosive rally after the breakout where price rose about the length of an average week.
Protect Profit
In addition, value areas are useful when defining risk. The value area high is often used to define risk when price is trending lower. And the value area low may be used to determine risk when price is rising. This technique can also be used to manage profitable trades. For instance, assume a long position is taken. The stop loss would be placed at the value area low. Now, let’s say the market traded higher during the next session. At the end of the session the stop loss will be moved higher to the value area low of the current day, thus locking in a winning trade. If the market continues the trend higher move the stop loss higher each day until the price dips below the stop.
End of Day Momentum Indicator
A close below the value area low frequently leads to lower prices during the next session. On the other hand, a settle above the value area high is a bullish signal.
A good trading system requires a solid foundation. When I was introduced to value areas, I knew I had found the base for my first trading strategy.
John Seguin, Market Taker Mentoring
