How to Improve Entry and Exit Prices
Traders strive to sell at extreme highs and buy near the low of a trend. Setting precise entry and exit levels is a difficult task, yet a skill that can be honed. In this business a long position or buy level is recognized as support and a short position or selling price is known as resistance. One of the ways to improve entry and exit is to look left on your charts to get a history lesson.
Fundamentals Move Markets
Economic data, earnings, weather, and supply and demand reports are the catalyst for trends, either up or down. Get in the habit of recording all events that alter trends or make them increase in speed. I recommend tagging the price where a market was just before it accelerated either higher or lower in response to an event or report. When such areas are retested, a reversal in direction or consolidation phase often follows.
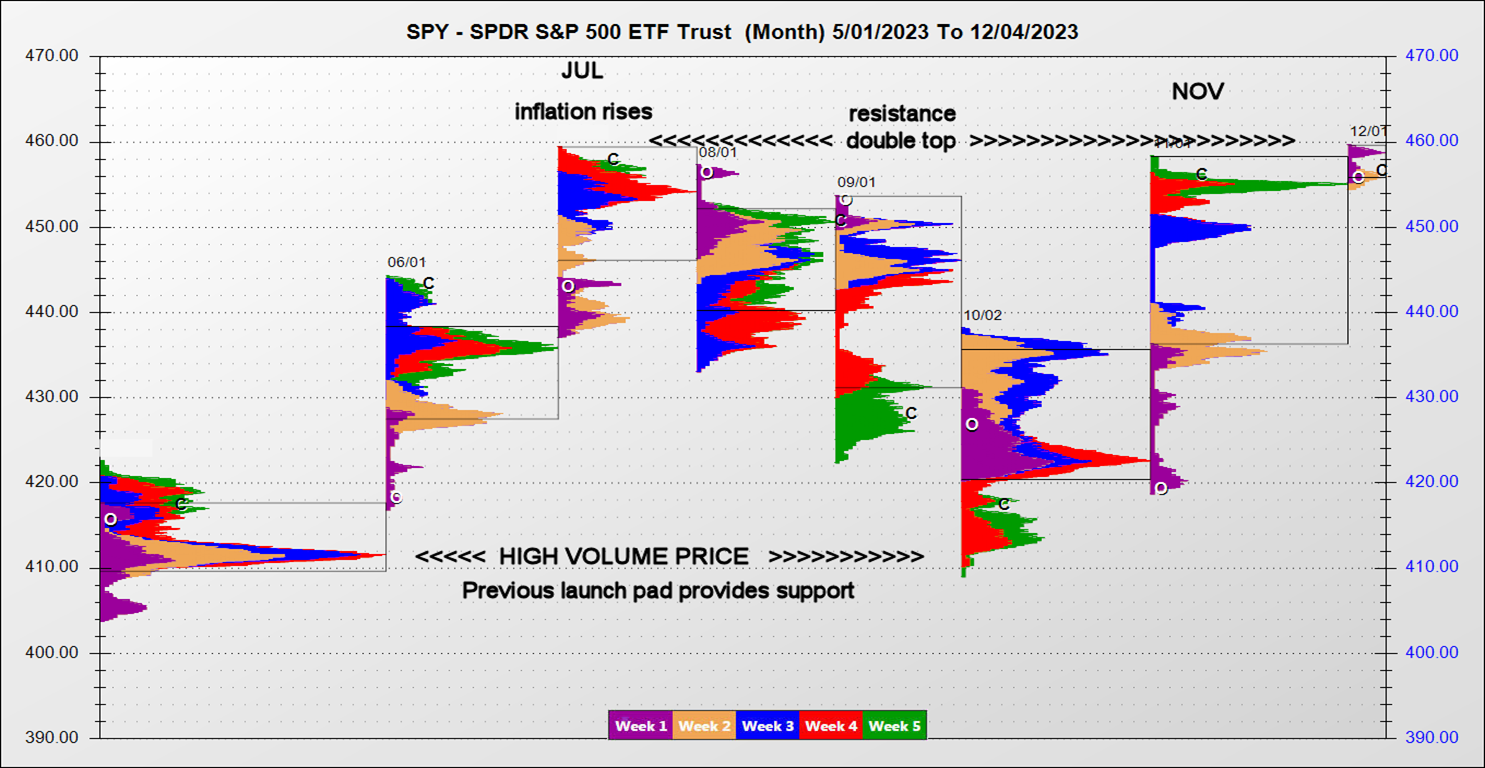
The SPY monthly chart below illustrates this concept. When SPY returned to the high-volume price in May, which was an acceleration point, an acute rally followed bulls response. Subsequently, the trend lower entered a holding pattern. When major support/resistance areas are tested butterflies and iron condors usually pay while the market enters a holding pattern or consolidation phase.
Highest Bounce or Lowest Dip
Markets often overshoot when volatility is high and panic reigns. Extreme highs and lows form during such times. Panic extremes frequently provide support/resistance when retested. The same chart shows the best bounce post-pandemic provided resistance when retested. A double top formed, and it has been the high point for nearly a year. Note that the low dip also provided support when revisited.
History Helps
Entry and exit areas are tough to call. Acceleration and congestion zones are the most reliable support/resistance areas. When a previous high/low or congestion area is retested, how do we know if a reversal in trend or consolidation period is likely? There are clues that tell us when a market is reversing direction or entering a phase where nondirectional trades (condors and butterflies) should pay off.
Bottom Fishing and Top Picking
When a market hits a support area there are subtle clues that tell us if buyers are responding. First, day ranges and volume will often decrease. Second, the low for the day tends to come in the first hour of trading. And closes tend to be near the upper quadrant of the day range. On the other hand, a resistance area forms when consecutive daily highs are made early in the session and closes are near the lower end of the day range. Candlesticks are a great tool to indicate bull or bear dominance. Long-body candles show power of direction and short-body candles signify neutrality.
Improve Entry and Exit
Professional traders integrate fundamentals with technics to gain an edge. Charts display history and history often repeats. Recording recent history on your graphs is essential to improve early entry and ideal exit zones. When bottom fishing cash secured puts should pay, and when top picking covered calls should be effective.
John Seguin
Market Taker Mentoring
