How to Trade Volume Voids
As a futures broker, I had many clients who used black boxes for trading signals. These automated trading systems are mainly developed to capture vertical moves. When a buy/sell signal triggers it frequently has a domino effect, which causes prices to move rapidly. The most common bullish breakouts occur when the top of a channel (flag) or pennant (triangle) is violated. A bearish trend often begins when the bottom of a flag or pennant is breached. The type of candlestick at the onset of a breakout can be revealing as well. Candles with full bodies and small wicks indicate power. Thus, a full-bodied candle passing through a trendline is often the catalyst for an above average vertical move. When a market breaks into a trend it is often fast and furious, leaving behind gaps or low-volume pockets known as volume voids.
Vertical versus Horizontal Phases
As an analyst and educator, I try to keep it simple by classifying market movements into two phases. The vertical phase may be described as a breakout, imbalance, trend, run, rally, dive or dip. A vertical phase is either bullish or bearish. During the horizontal phase a market is thought to be consolidating, congesting, balancing, coiling, resting or developing value over time. Rest phases follow run phases, which lead to rest phases and the process repeats.
Leaving Low-Volume Zones Behind
When markets break out of consolidation phases they often do so quickly with above average volume and ranges. Run phases can be violent as the market moves from balance to imbalance. During such runs markets move with time; they do not stop to rest or develop value. While doing so low-volume zones or pockets are often left in the wake.
Filling Volume Voids
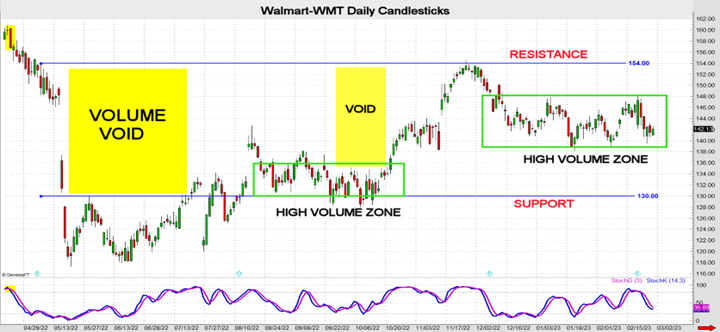
Low-volume zones typically have both a trend higher and lower with candlesticks that usually have long bodies and very little overlap in price. The initial rally and decline define the barriers (support and resistance areas) that will contain most of the volume in the future. The Walmart daily chart below illustrates this common pattern. A trend lower accelerated in May, and the trend higher started in October and finished in late November. The volume voids that were left behind eventually became high-volume zones. I think of this pattern as a puzzle with pieces missing. A new trend may not commence unless the missing piece (volume) accumulates in the open area or volume void.
Apply Neutral Strategies
Once this pattern is recognized neutral strategies should be applied. A mean reversion strategy works well in this environment. Simply wait until the market tests the support area and buy the underlying, buy calls or sell puts depending on implied volatility. Or sell the underlying, purchase puts or write calls when the resistance area is tested. This pattern is ideal for neutral option strategies. An aggressive approach would be to short a straddle. A moderate aggressive strategy would be to short a strangle. Selling an iron condor is a less aggressive approach. Rather than apply your favorite strategy on any pattern, it is better to identify the pattern and apply the best tactic.
John Seguin, Market Taker Mentoring
