How to Read Candlestick Cues
All technical tools and indicators have strengths, but it may be more important to understand their weaknesses. The trick to using technical tools is to identify a pattern or indicator that commonly precedes a high percentage trade. I have studied many charting techniques and tools in my 30-plus years in the commodity markets. Whenever I come across a pattern that has consistently led to a payoff, I enter it in my toolbox or journal. I have a section called “candle confidence,” which are patterns that fit my personal technical style. I categorized the signals into three types of setups: directional, consolidation and breakout.
Reliable Candle Patterns
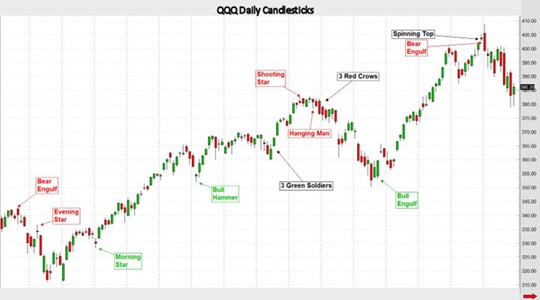
There are hundreds of candlestick patterns. I search for some of the most reliable candlesticks and candle patterns that are the cues that increase the probability of catching trends and identifying reversals. Single candles are useful for determining momentum or the lack of it. A series of certain candles are often more reliable than just one. The graph below illustrates some of my favorites from my toolbox. Green candles are generally bullish while the red tend to be bearish. Consecutive red or green candles are usually stronger signals for interpreting direction.
Directional Candles
One of the most reliable directional signals is called a bullish engulfing setup. This setup works best after a couple of candles with below average ranges, followed by an above average range that surpasses both the low and high of the previous candle. This is also known as an outside day. Bear engulfing candles work just as well, but the close is lower than the open.
Another revealing candle is called a hammer. A bear hammer (a.k.a. shooting star) has a long wick from the high and closes very near the open of the candle. This structure often leads to lower prices going forward. A bull hammer would have a long wick from the low and an open and close that are very near each other. Another bearish candle, called the hanging man, opens near the high and heads immediately lower with a recovery that falls short of testing the high leaving a long wick at the bottom.
3 Candle Pattern
A series of 3 consecutive candles moving in the same direction with the same color is often a powerful trend signal. The bullish setup is called 3 green soldiers while the bearish setup is known as 3 red crows. Examples of both are shown in the chart above.
Neutral or Pre-Trend Candles
When markets open and close near the same price it is an indication of neutrality. Candles with small bodies are a sign of impartiality. Markets often shift to neutral before a trend commences. Some common neutral candles are shown in the chart as morning star, evening star and shooting star. Generally, they look like plus signs.
Choosing Your Tools
To build your own personal trading toolbox, search many disciplines and choose the tool and indicators that suit your style and time frame. If you prefer to trend trade these candle setups should help improve timing the entry or exit of a position.
John Seguin
Market Taker Mentoring
