How to Use Indicators in Your Trades
There are no trading tools, indicators or patterns that pay off every time. However, they all have their moments. Good traders know when probabilities have shifted to favor a trend-style trading strategy or a neutral (countertrade) approach. There are two essential technical indicators that traders utilize to create strategy. The vertical indicator measures range (height) over various time frames. This indicator measures the speed of a trend. The horizontal indicator measures width during consolidation phases. Width or time at price reveal fair value areas. Using logic and these two dimensions is vital when choosing to employ directional or neutral option strategies.
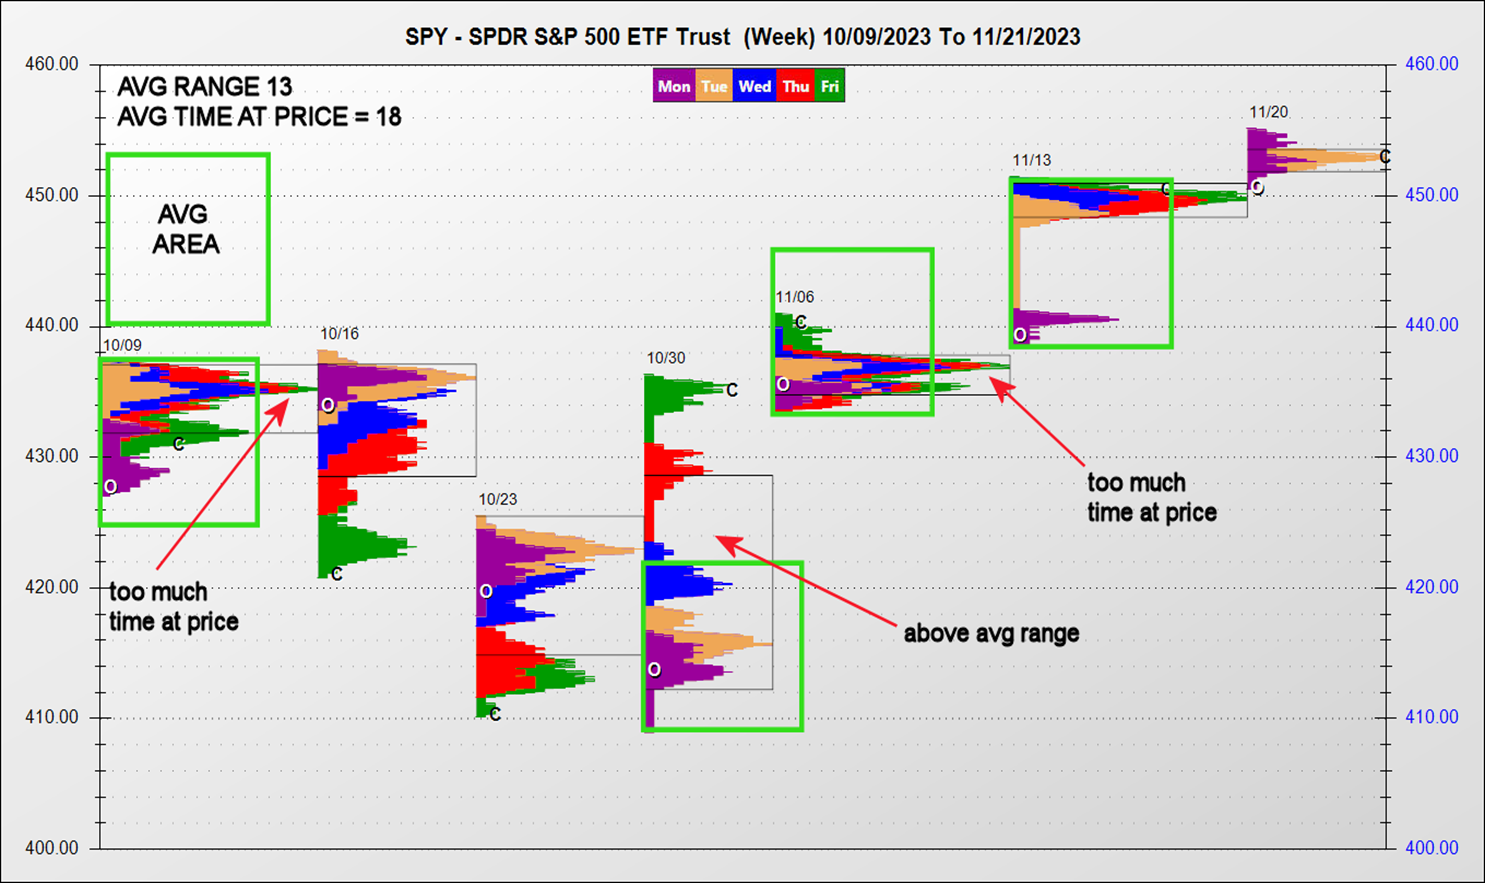
To visually capture the dimensions of range (vertical) and time at price (horizontal) see the chart below. These are also known as bell curves or profiles. The boxes show the area (length x width) of an average week. When the time at price (TAP) exceeds the standard, a sharp vertical move often follows. Thus, vertical or directional option strategies should pay. On the other hand, when the range is far above average (overbought/sold) a short wide profile frequently follows. In this case, neutral strategies like short strangles or straddles often pay.
Top Pre-Trend Indicators
Trends frequently begin after abnormally long periods of consolidation, and consolidation phases often follow above average vertical moves or trends. The most logical tools to time the onset of a trend include ATR (average true range), moving averages and MACD (moving average convergence divergence).
Breakout Indicators
Traders need to be aware of the traits of the stock, ETF or commodity they plan to trade. Begin using ATRs by day and week. I prefer a 14-day and 9-week ATR to measure when a market is ripe to trend. If the range over a 3-day span is less than an average day range and the range over a 10-day period is about 50% of an average week range, odds for a breakout increase significantly. Consecutive small-bodied candles (similar open and close) are common before an acute move. Markets are often tethered to a short-term moving average (5-day MA) for a few days just before the onset of a trend. When these conditions are realized directional option strategies typically pay.
When to Employ Neutral Strategies
Vertical measurements are also useful when timing the end of a trend. Instead of using contraction indicators to recognize the start of a trend, use range expansion indicators to reveal when a trend is exhausted. ATRs may be used to identify when a market has gone too far, too fast. Refer to the benchmark ATRs mentioned above. If a day range reaches twice the 14-day ATR or if a 5-day move spans twice the length of the 9-week ATR, it is deemed to have traveled too far, too fast. This increases the odds for a consolidation phase, during which it is best to employ neutral option strategies such as iron condors and butterflies.
MACD is helpful when timing the end of a trend. The difference between a 5- and 20-day MA is a solid short-term gauge. When the difference is unusually high trends often slow or reverse. A series of long-bodied candles are common during trends. When trends near exhaustion the wicks of candles tend to be larger than the bodies.
Logic and Market-Generated Information
Beginners should start with the basics (length and width). Markets do two things: trend and consolidate. Using market-generated information (technics) and logic you can build a strong foundation, which is required to create trading strategies for the novice as well as the professional.
John Seguin, Market Taker Mentoring
