How to Identify Reversal Points
Picking tops and bottoms of market moves is a skill traders desire to perfect. Perfection is the goal, but picking absolute lows and highs is not realistic. However, we can hone this skill through observation and practice. Here are a few exercises I learned over many years of observation.
- Make it a habit to review history in charts after an extreme high or low has been made. Markets frequently reverse after retesting a previous low/high that was made in the first hour trading.
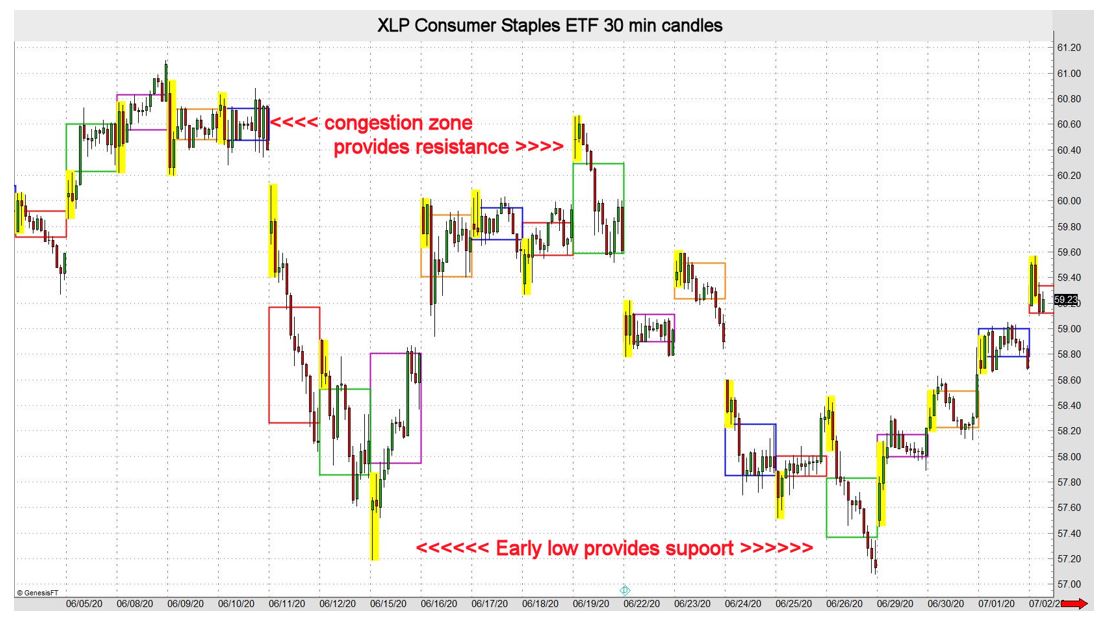
- Extremes tend to be made near old consolidation areas. These congestion zones often comprise three to five days of severe overlap in price. Small daily candle bodies are common during consolidation phases. Reversals often occur when price revisits a previous high-volume zone and trends often commence at such areas.
- Gaps in price from open to close are more common with stocks and ETFs. When these gaps are retraced, they often provide support/resistance
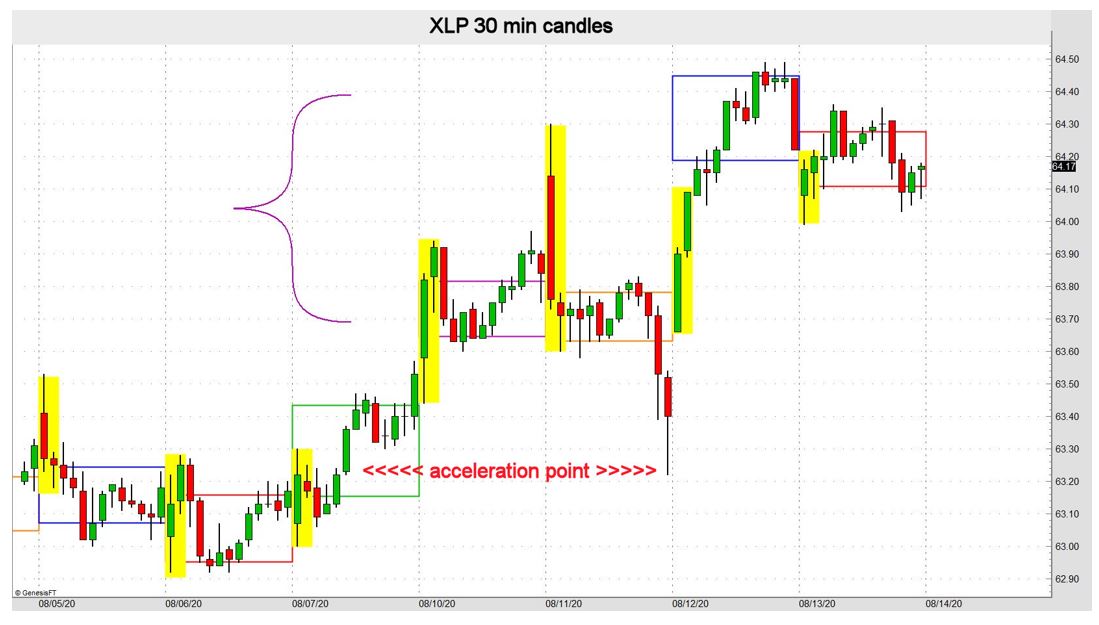
- My favorite and most reliable pattern for defining support/resistance is deemed an acceleration point. I prefer to search for them using 30-minute candles (see chart below).
The idea is to find levels where the market shoots higher or lower at above average speed (length). The cart below illustrates this phenomenon. It is a candle with no overlap in the ensuing candle and is quite common at the onset of trends. These acceleration points frequently provide support/resistance when retested.
John Seguin, Market Taker Mentoring
Trader Education
- Educational Webinars for Traders
- Trading eBook
- The Options Insider Radio Network
- Market News and Education
- Set Profit Targets and Define Risk Using ATR
- Don't Forget to Add Up Option Greeks
- Understanding the Secret to Stochastics
- How Straddles and Strangles Work
- Check Your List Before Entering a Trade
- Option Trading and Life Are Not Perfect
- Identifying Price Patterns
- Hard Profit Taking Option Orders
- Define Support and Resistance Zones
- Theta Can Be Friends with Delta
- How to Handle Low-Volume Pockets
- Vertical Spreads Are an Option
- Focus on the Appropriate Moving Averages
- The Market Is Resilient
- Avoid Poor Trade Location
- It's All About Experience as an Option Trader
- The Shift in Fundamental Focus: Inflation vs. Recession
- Option Trades Near the Close
- Fundamental Shift and Volume Voids
- Be Patient When Markets Are Volatile
- Look to the Pros for a Trading Edge
- Your Option Trading Day in a Nutshell
- Best Uses of Bollinger Bands
- Take Advantage of a Bullish Base
- Use Chart Techniques to Trade Like a Pro
- Look For Pullbacks in NVDA
- Versatility of Average True Range
- Interpreting Technical Nuances and Market Reactions
- Smart Traders Record Their Trades
- Trade With Passion and a Plan
- Watch How a Stock Closes
- Finding the Ideal Trade Location
- Delta Is Lead Dog for Vertical Credits
- Dealing With Market Pace Problems
- Option Trading Is Almost Always a Trade-Off
- Seek the Answers Professionals Do
- What Has a Better Chance of Happening?
- Using Fair Value as a Trade Foundation
- Returning to the Proverbial Option Trading Well
- How to Use Daily Pivot Prices
- Time to Tighten Up Your Option Management
- Improve Trade Entry with Timing Tools
- The Market Does Not Always Go Up
- How to Read Candlestick Cues
- Chat About Option Vega
- Note Patterns to Identify Market Trend Changes
- Theta Can Help Your Unwanted Delta
- Partner Stochastics with Divergence
- Option Greed Is Not Good
- Choosing the Right Trading Tools
- A Top Tool for Traders
- Take Some Time Off for the Holidays
- How to Improve Entry and Exit Prices
- An Alternative to Selling Option Premium
- How to Use Indicators in Your Trades
- Avoiding Stress as an Options Trader
- Reversals and Overbought/Oversold Markets
- Are You Making Time for Theta?
- Pro Traders Commit to Routines
- Do Not Roll Your Short Option Too Soon
- Taking Profits and Trailing Stops Using Targets
- Bear Call Trades on SPY
- Moving Averages vs. Pivot Points
- Are You Guessing Too Much as an Option Trader?
- How to Recognize Changes Indicating a Shift in Trend
- That Voice Inside Your Head
- Option Vega Can Be Tricky
- Patience and the Market Close
- Use Stochastics for Reversals, RSI for Momentum
- A Look at Technical Analysis Basics
- My Checklist for Entering Trades
- A Look at IV Levels Around Earnings
- Good Timing Reduces Risk and Increases Profit Potential
- Use Market Tendencies to Your Advantage
- Uncover Clues That End or Reverse Trends
- Basic Technicals for Choosing Trade Type
- Get Friendly in Your Trading
- The Benefits of Bollinger Bands
- Know Your Option Delta Basics
- Think Like a Pro to Trade Like One
- Volatility and Vertical Debit Spreads
- Timing Reversals Using Stochastics
- Successful Option Trading Is Not Easy
- A Pragmatic Approach to Trading
- Covered Calls Can Work Wonders
- Use ATR to Project Profit and Manage Risk
- Have You Written Your Trading Plan?
- Technical Tools to Fit Your Trading Style
- Trading Options After Gaps Can Be Difficult
- Panic Adds Pace to Market Movement
- A Good Old-Fashioned Bull Call
- How to Trade Volume Voids
- Improve Results with Profit Taking Orders
- Which Trade Indicators Pair the Best?
- Some Bearish Setups Are Bullish
- Tools of the Trade
- Meet Your New Best Friend
- Recession Fears Take Center Stage
- How Do You Feel About Adjustments?
- History Helps Determine Support and Resistance
- Using ATRs to Set Profit Targets and Define Risk
- Take a Trading Break for the Holidays
- Improve Your Trade Location
- Do Not Forget About Iron Condors
- Alleviate Stress With Timing Techniques
- Option IV Levels Are Important, But
- Set Your Rules for the Tools of Trading
- Trust Resistance Over Your Gut
- Choosing Moving Averages Based on Trading Time Frame
- Stop Always Thinking Bullish Trades
- Define Risk and Lock in Profits with Stops
- SPY Double-Bottom Was No Surprise
- How to Think Like a Trading Pro
- An Options Trading Routine Is Smart
- Prepare for Panic and Learn
- Use Positive Theta to Offset Delta Risk
- Make Publishing Your Game Plan a Priority
- Support and Resistance Are Your Edge
- How to Identify Market Extremes
- Option Management Is Key
- Technical Overload: Keep It Simple
- Understanding the Nuances of Option Delta
- Essential Technical Tools for Trading
- The Basics of Implied Volatility and Options
- How to Read Big Player Trader Patterns
- Tighten the Leash on Your Option Trades
- Gauging a Trend Too Far, Too Fast
- Long Puts Are a Viable Option
- Practical Uses for Average True Range
- Don't Be a Cocky Trader
- Take a Break From Options
- What Do You Know About Option Theta?
- Improve Timing When Entering a Position
- Understanding Risk and How to Reduce It
- Organizing Prices to Identify Patterns
- Most Option Traders Roll Strikes Too Soon
- Systematic Trading With Technicals and Fundamentals
- A Warning About Selling Naked Puts
- Your Checklist Before Entering a Trade
- How to Trade Low Volume Pockets
- Using Candlesticks to Catch Trends
- 2 Crucial Option Trading Mantras
- Enhance Trade Timing with Intraday Direction Indicators
- Trading Lower Highs and Lower Lows
- Using Average True Range to Identify Trade Type
- Trading and Filtering Continuation Trades
- Keeping the Context When Trading Patterns
- Wheats the Matter with the Grains?
- How to Diagnose Trend Potential
- Sprinting Into a Trend
- How to Choose a Stop Loss
- Choosing an Optimal Stop Loss
- Do This Before Placing Your Trade
- Before Trading, Ask These Questions
- Is Psychology Important in Options Trading?
- How to Save Time Scanning Market Patterns
- Can You Make Money Trading Options?
- Implied Volatility vs. Historical Volatility
- Trading Is Like a Box of Chocolates
- Is Option Trading Easy?
- When a Market Moves Too Far, Too Fast
- Using Iron Condors in Volatile Markets
- Learn How to Read Price Action
- How Does an Options Calendar Work?
- Uses for Average True Range
- A Look at Bearish Vertical Credit Spreads
- Liquidity Is King
- Your Option Trading Mantras
- How Will Employment Report Impact Markets?
- To Trade or Not to Trade
- Great Traders Create a Methodology
- Option Traders Often Adjust Too Soon
- Market Movement Speed Dictates Strategy
- When in Doubt, Option Spread It Out
- Pro Trader Move Markets
- Create a Manageable Stock Watchlist
- How to Scan Markets for Breakout Potential
- Using Spreads to Offset Risk
- How to Form Your Methodology as a Trader
- Find an Option Trading Friend
- How to Stock Your Trading Toolbox
- Not Option Trading Is a Gift to Yourself
- Identifying Trends and Turns Using ATR
- When to Consider a Spread
- How to Manage Your Trading Team
- Be Patient When Rolling Short Options
- Never Take Your Eye Off the Fed
- Consider These Strategy Building Basics
- Is It Safe to Trade Naked?
- Identify Trend Potential and Protect Profit
- Market Making You Anxious?
- How to Gauge Trend vs. Non-Trend Markets
- Navigating a Volatile Trading Environment
- The Trend is Your Friend More Times Than Not
- Is It Safe to Countertrade Extreme Moves?
- A Relief Guide for Stressed-Out Traders
- Picking Extremes in Extraordinary Times
- Volatility: The Key to Success in This Market
- Volatility and Volume Gaps
- Recognizing the Importance of Option Delta
- Adjusting for Spikes in Volatility
- Using Volume Voids to Your Advantage
- Using Support and Resistance to Your Advantage
- How to Tell a Trend Is Near Its End
- Your Option Routine Should Be Routine
- Think Like a Pro to Trade Like One
- How Many Contracts Should You Trade?
- How Do Economic Reports Rank by Impact?
- What You May Not Know About Option Delta
- How to Gauge Volatility for Q3
- Feeling Superstitious? Reduce Your Risk
- How to Define and Scale Risk
- Does Your Option Delta Make Sense?
- Using Market Tendencies to Your Advantage
- Option Spreads Can Offset Risk and Much More
- How to Identify Reversal Points
- Make Friends With the Market
- Fundamental Data Come First
- Option Profits Can Come Quickly
- Keep Your Cool During Market Panic
- Want to Get Better at Option Trading?
- Rolling Options Requires Patience
- How to Define Risk Using Time
- When a Stock Reaches a Target Area, Do Something
- A Look at 'Cup and Handle' Chart Patterns
- Option Greeks Multiply Like Rabbits
- The Ins and Outs of Inside and Outside Signals
- Long Calls Are an Option That Can Work
- A Look at Sector Relationships
- Know Your Option Trading Environment
- Track Seasonal Trading to Gain an Edge
- Spreads Can Be an Option Trader's Best Friend
- The Value of Average True Ranges
- Call Credit Spreads for a Non-Bullish Environment
- The Power of the 'King Candle'
- What Does Option Trading Mean to You?
- What You Can Learn From Liquidity
- Understanding Stop Losses and Options
- The GameStop Phenomenon: Pro vs. Retail Traders
- Use Fundamental Data to Set Risk and Profit Targets
- Know the Greeks and Their Potential Impact
- Gauging Market Speed and Reversals
- A Look at Bullish Option Strategies in NIO
- Build Your Own Technical Toolbox
- Remove Risk First, Consider Profits Second
- How to Create a Pre-Trade Checklist
- Keep an Eye on Implied Volatility During Earnings
- Make Time to Study Options Trading
- Option Traders Need to Consider Spreads
- Identify Neutrality for Trend Reversals
- What Does a Bullish Base Look Like?
- Confirm Market Turns Using Stochastics
- Sometimes Doing Nothing Is a Trader's Most Profitable Move
- Identify Trend Potential and Entry Levels
- Long Calls Are a Solid Option
- Use Dimensions for Timing Breakouts and Setting Targets
- Keep Your Trading Watchlist Fluid
- Pandemic Panic and How to Adjust Your Trading
- Your Regular Reminder to Review Your Option Trades
- How to Use Bollinger Bands
- Have You Checked Your Option Vega?
- Top Techniques for Defining Support and Resistance Areas
- Do You Guess Too Much as an Option Trader?
- Options Arbitrage and Valuation
- An Option Spread Can Relieve Some Doubt
- Cures for a Trader's Optimistic Bias
- Waiting for a Move Through Resistance
- Shedding Some Light on SPACs
- Removing Risk as an Option Trader
- Don't Trade While Inattentive
- Do You Have Time for Theta?
- Understanding the Seasonality of Implied Volatility
- Is Option Risk Worth the Reward?
- Meme Stock Phenomenon Sparks FINRA Crackdown
- Earnings Season Is Not Time for Naked Puts
- Impact of Increased Retail Trading Volume
- Varying Contract Size to Manage Risk
- Understanding Dividends and Options Trading
- When in Doubt, Consider a Spread
- A Brief Lesson on Pairs Trading
- Making Option Delta Easy to Understand
- Trading Software and Hardware Optimization Improves Your Win Rate
- Improve Your Odds for Trading on the Close
- How to 'Safely' Trade Crypto/Blockchain Assets
- Morning Gaps Can Be a Head Fake
- The Impact of Inflation on Financial Sectors
- Calendar Spreads Ooze Positive Theta
- How To Protect Yourself from HFTs
- Learn Options Trading with a Paper Trading Account First
- Stock Options Advice: Investor, Know Thyself
- Synthetics in a Low Volatility Environment
- An Effective Strategic Option Trading Plan Requires Flexibility
- Flash Boys and the Tower: FCC License Number 1215095
- The Greeks
- Creating a Low Cost Collar
- How Patience Will Earn You Money In The Stock Market
- Advanced Trading: Going Long and Short on the Same Instrument in the Same Account
- Butterfly Spreads: Part C
- Understanding Butterfly Spreads: Part B Variations
- How to Get Your Wife to Support Your Trading
- Butterfly Spreads - Part I
- When Should You Take Advantage of the Early Exercise Right?
- Understanding Front Month Gamma
- Subscribe to the Traders Exclusive Video Feed
- Watch Traders Exclusive Videos on YouTube
- Follow Traders Exclusive on Twitter
- Become a fan of Traders Exclusive on Facebook
