A Top Tool for Traders
Typically, markets are quiet during the last two weeks of the year with below average ranges and volume. It allows me the time to do research in preparation for the upcoming new year. I enjoy statistical analysis because each clue is a piece of the puzzle traders try to solve every day. Range length is one of my top tools for creating strategies.
ATR
The most important spreadsheet I generate consists of recent average true range and long-term ranges for stocks, ETFs and commodities. Most charting platforms have the ATR (Average True Range) indicator. ATRs are valuable because they improve our ability to set profit targets and define risk over various time frames. Furthermore, a comparison of near- and long-term benchmarks can be used to determine if volatility is rich or cheap.
Option Plays Using ATR
One reason for comparing historic and current data is to identify trend potential. When recent day and week ranges are far below the benchmark (long-term average), odds increase for a breakout or onset of a trend. Under these circumstances buying options and/or debit spreads tends to be a more effective strategy. On the other hand, when recent ranges are far above the long-term standard, a consolidation phase typically follows. Thus, selling premium or executing credit spreads tends to be a better approach. Think time decay or theta trades (short options).
Once a trend or breakout begins, we need to project how far the market will travel and how long it will take. I frequently use ATRs to set targets over various time frames. For example, assume a market has been in a tight range for five sessions. Let’s also assume volume has been below average and the day ranges are lower than standard. If the opens and closes are similar as well, probability favors a sharp vertical move. A straddle purchase may pay under these conditions.
Project Targets
Here are some basic rules for creating profit targets. When the direction of a breakout is recognized, the next step after entry is to set risk, then project profit targets using ATR. The first target should be the length of an average day. Target 2 is the length of an average week, and an average month range would be target 3.
Another earnings season is upon us. Volatile sessions and above average ranges are anticipated. During earnings season price projections become more difficult. ATR can also be used to determine if a market has moved too far, too fast, otherwise known as overbought or oversold. For example, if a market moves the length of an average month in a week it is thought to be overdone. Thus, a countertrading strategy may apply. This method is a good framework to begin with. I use many variations (percentages) of this technique when testing theory.
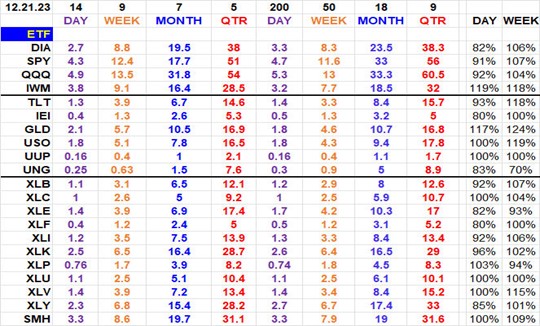
The ATRs I prefer for comparisons are as follows:
- 14 days vs. 200
- 9 weeks vs. 50
- 7 months vs. 18
- 5 quarters vs. 9
Find time for research to create your own spreadsheet of average ranges of your favorite stocks or commodities. A good trader prepares and has pertinent data available to set risk and targets immediately after entering a position. To get you started the spreadsheet below shows ATRs of popular ETFs. There is also a percentage between the short- and long-term ranges.
John Seguin, Market Taker Mentoring
