Confirm Market Turns Using Stochastics
The myth is that Stochastics and RSI (Relative Strength Index) are both used to determine whether a market has reached overbought/oversold status, thus indicating when a trend is near an end or likely to reverse direction. However, RSI is more appropriate for gauging strength of trend. An RSI reading above 50 indicates bullish momentum and a reading below typically favors short positions, while a Stochastic is a more reliable indicator for identifying market turns.
A Fast and Slow Combination
The Stochastic oscillator comprises the first line known as %K. The second line known as %D is a simple moving average of the %K. The most common setting for the Stochastic oscillator is 14 periods for %K along with a 3-period SMA (simple moving average) of %K, which is %D. In other words, %K is the faster moving Stochastic and %D is the slow one. Generally, the fast indicator is used for short-term trades, and the lagging turns in the slow Stochastic are more reliable for longer-term trades.
Stochastic Crossing Signals
Simple moving average crossings are possibly the most popular technical indicator for new traders. Seasoned traders tend to employ more complex indicators, such as %K crossing %D Stochastics. When %K crosses below %D a sell signal is generated. Conversely, a buy signal is produced when the fast gauge crosses above the slow one.
Overbought and Oversold Levels
The Stochastic oscillator range fluctuates between 0 and 100 no matter how fast price ascends or descends. Traditionally, a reading above 80 is the overbought threshold and a reading below 20 is an indication of an oversold situation. A reading above 80 is not always a bearish signal nor is a reading below 20 bullish.
Combine Overbought/Oversold with Traditional Range
To enhance the strength of a bullish or bearish signal, combine the signals with the 20 to 80 thresholds. If the slower Stochastic (%D) is above 80 and the faster Stochastic (%K) crosses below %D, the sell signal is generally more reliable. On the other hand, if %D is under 20 and %K crosses above %D, a bullish move is probable.
Bull and Bear Divergence
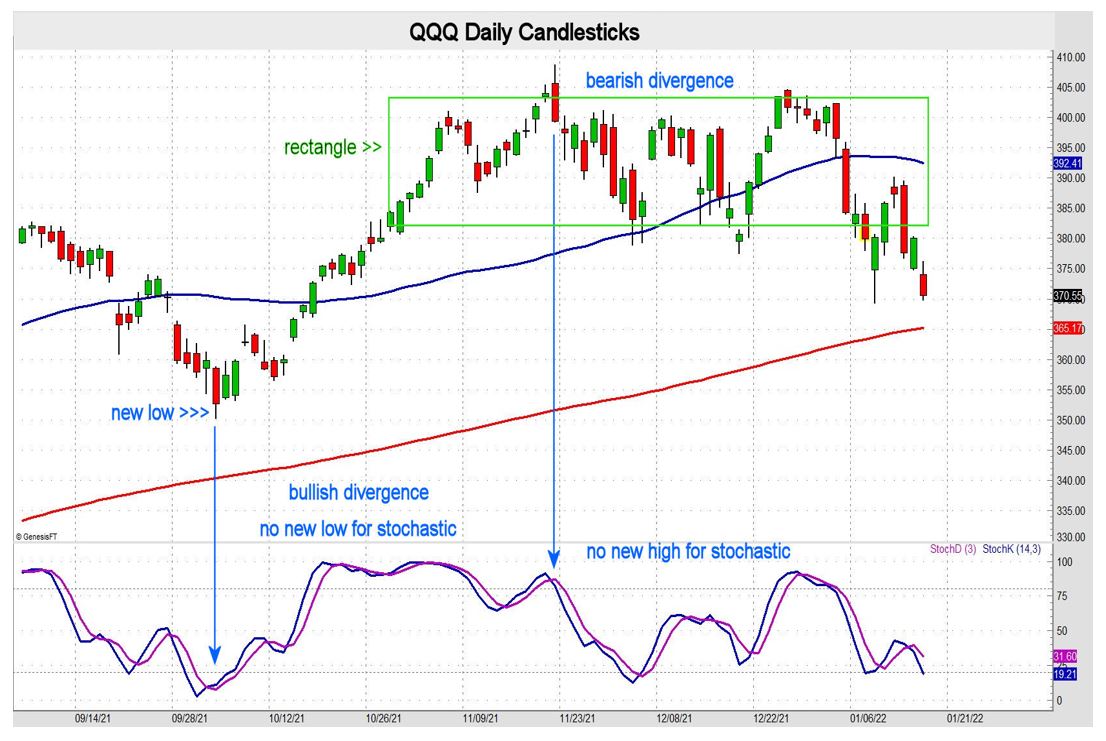
My favorite use of this oscillator includes extreme highs or lows in price with peaks and valleys for the Stochastic. A bullish divergence takes shape when price reaches a lower low but the Stochastic forms a higher low. In this situation a bullish reversal frequently occurs. A bearish divergence occurs when a new high in price is not confirmed with a new high in the Stochastic. This reveals a loss of momentum and often foreshadows a bearish reversal.
Divergence Confirmation
After bullish/bearish divergence is realized it is important to look for confirmation. Midway between the 20 and 80 Stochastic thresholds is 50. If a bearish reversal is recognized a breach of 50 would confirm that bears are in control. If bullish divergence is identified confirmation comes when 50 is penetrated.
The chart below shows a couple of examples of divergence for the Nasdaq ETF QQQ. Stochastics are one of the most effective indicators for picking tops and bottoms during choppy trendless phases. Such phases often take the shape of flags (rectangles) or pennants (triangles).
John Seguin, Market Taker Mentoring
