How to Read Option Volatility Charts
Posted on Tuesday, March 1, 2022 at 4:25 PM
Dan Passarelli, CEO - Market Taker Mentoring
I'm often asked how to read option volatility charts. And it's as simple as 1, 2, 3!
There are 3 steps to reading volatility charts for options traders. First, observe if today's implied volatility is above or below today's historical volatility. Next we observe if today's implied volatility is in the top or bottom half of the 6-month range. Then finally, we forecast what volatility is likely to do in the future, by looking at expected volatility events, like earnings, Fed announcements (FOMC meetings) or the release of the unemployment situation on the first Friday of the month.
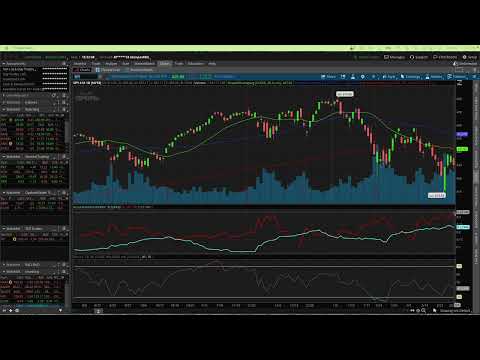
This video explains how this affects options valuation.
« Previous PostBig Range in the US Stock Market Today Next Post »Eerily Quiet Market Today
